fetching data ... 
Background: Heterogeneity in disease populations complicates discovery of risk factors. To identify risk factors for subpopulations of diseases, we need analytical methods that can deal with unidentified disease subgroups.
Objectives: Inspired by successful approaches from the Big Data field, we developed a high-throughput approach to identify subpopulations within patients with heterogeneous, complex diseases using the wealth of information available in Electronic Medical Records (EMRs).
Methods: We extracted longitudinal healthcare-interaction records coded by 1,853 PheCodes[1] of the 64,819 patients from the Boston’s Partners-Biobank. Through dimensionality reduction using t-SNE[2] we created a 2D embedding of 32,424 of these patients (set A). We then identified distinct clusters post-t-SNE using DBscan[3] and visualized the relative importance of individual PheCodes within them using specialized spectrographs. We replicated this procedure in the remaining 32,395 records (set B).
Results: Summary statistics of both sets were comparable (
Summary statistics of the total Partners Biobank dataset and the 2 partitions.
|
|
|
|
|
|---|---|---|---|
| Entries | 12,200,311 | 12,177,131 | 24,377,442 |
| Patients | 32,424 | 32,395 | 64,819 |
| Patientyears | 369,546.33 | 368,597.92 | 738,144.2 |
| unique ICD codes | 25,056 | 24,953 | 26,305 |
| unique Phecodes | 1,851 | 1,853 | 1,853 |
We found 284 clusters in set A and 295 in set B, of which 63.4% from set A could be mapped to a cluster in set B with a median (range) correlation of 0.24 (0.03 – 0.58).
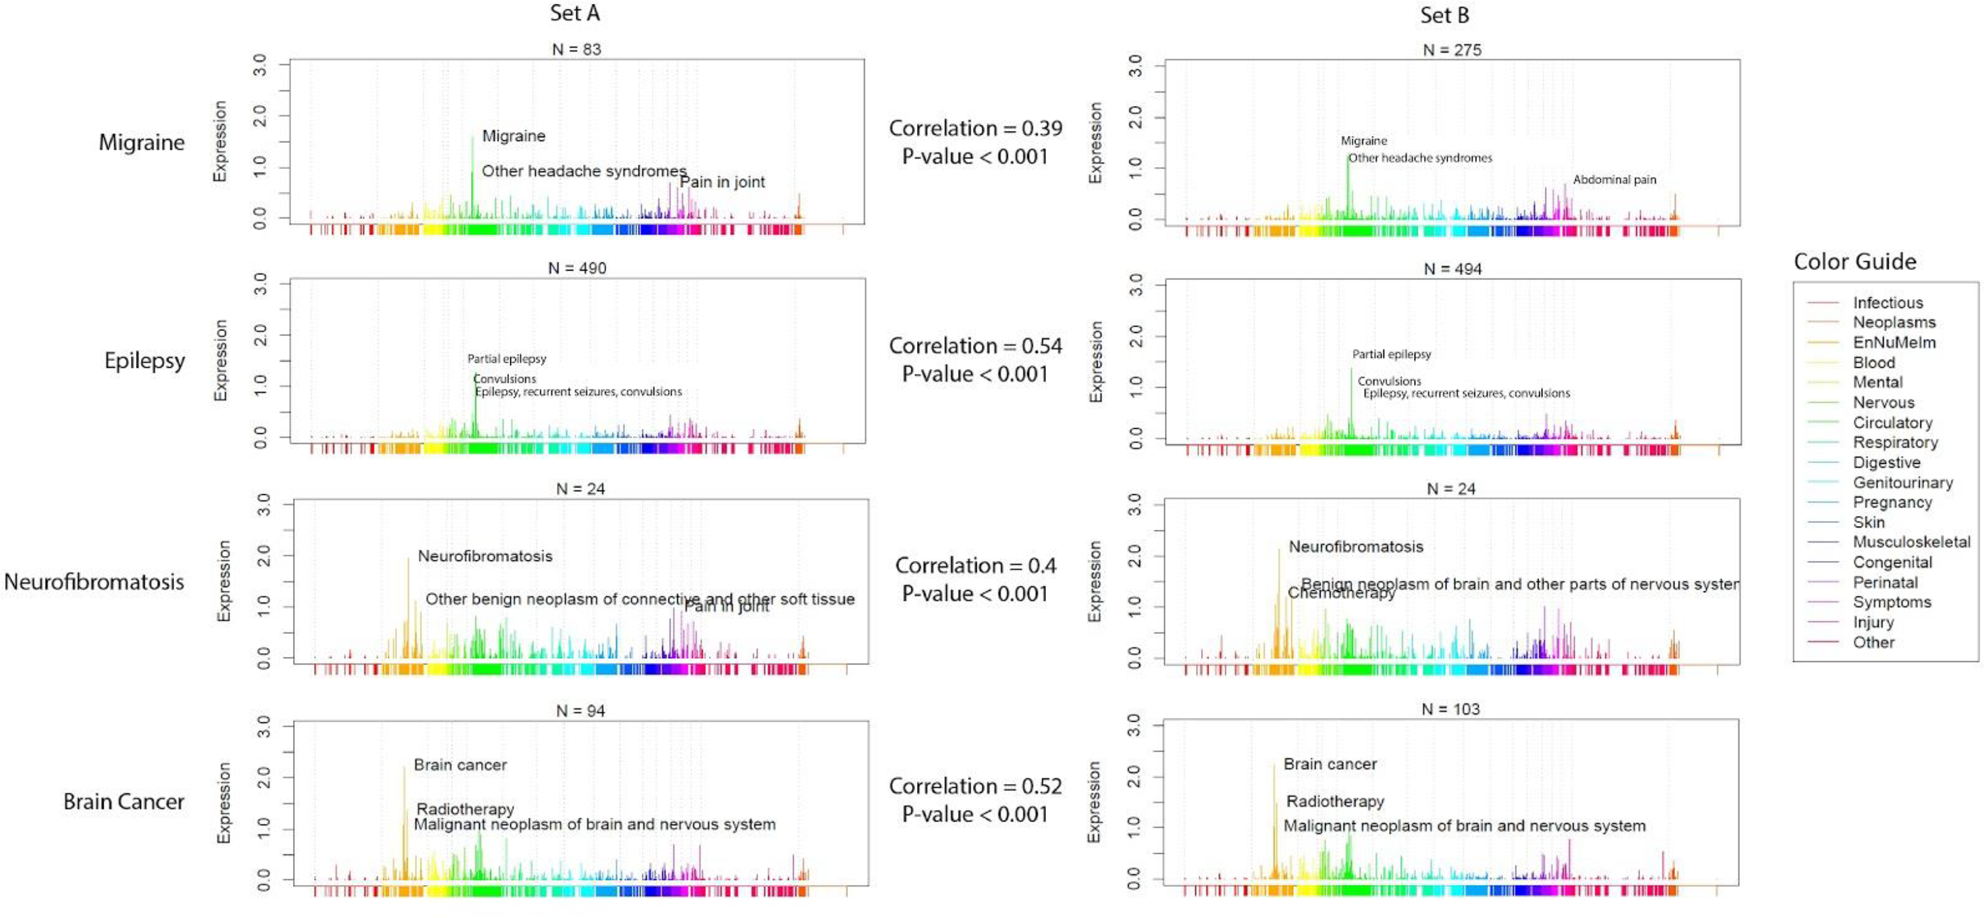
Clusters represented similar yet distinct clinical phenotypes; e.g. patients diagnosed with “other headache syndrome” were separated into four distinct clusters characterized by migraines, neurofibromatosis, epilepsy or brain cancer, all resulting in patients presenting with headaches (
Two dimensional representation of Set A generated using dimensionality reduction (tSNE) and clustering (DBScan).

Phenotype Spectrographs (PheSpecs) of four clusters characterized by “Other headache syndromes”, driven by codes relating to migraine, epilepsy, neurofibromatosis or brain cancer.
Conclusion: We have shown that EMR data can be used to identify and visualize latent structure in patient categorizations, using an approach based on dimension reduction and clustering machine learning techniques. Our method can identify misclassified patients as well as separate patients with similar problems into subsets with different associated medical problems. Our approach adds a new and powerful tool to aid in the discovery of novel risk factors in complex, heterogeneous diseases.
REFERENCES:
[1] Denny, J.C. et al. Bioinformatics (2010)
[2]van der Maaten et al. Journal of Machine Learning Research (2008)
[3] Ester, M. et al. Proceedings of the Second International Conference on Knowledge Discovery and Data Mining. (1996)
Disclosure of Interests: Marc Maurits: None declared, Thomas Huizinga Grant/research support from: Ablynx, Bristol-Myers Squibb, Roche, Sanofi, Consultant of: Ablynx, Bristol-Myers Squibb, Roche, Sanofi, Marcel Reinders: None declared, Soumya Raychaudhuri: None declared, Elizabeth Karlson: None declared, Erik van den Akker: None declared, Rachel Knevel: None declared