fetching data ... 
Background: The aim of this study is to determine the frequency of sarcopenia at the time of diagnosis in RA patients, evaluate the effects of sarcopenia on RA disease activity, prognosis and examine the factors that may be associated with sarcopenia.
Objectives: To determine the frequency of sarcopenia at the time of diagnosis in rheumatoid arthritis (RA) patients, assessing disease activity and factors that may be associated with sarcopenia and observe effects of treatment on sarcopenia.
Methods: A prospective study was conducted on RA patients with newly diagnosed. Patients were evaluated twice, at the time of diagnosis and three months after the initiation of treatment. Demographic data, anthropometric measurements, disease activity scores and sarcopenia status were recorded. Sarcopenia was evaluated with grip strength and bioelectric impedance. The results were also compared with healthy volunteers.
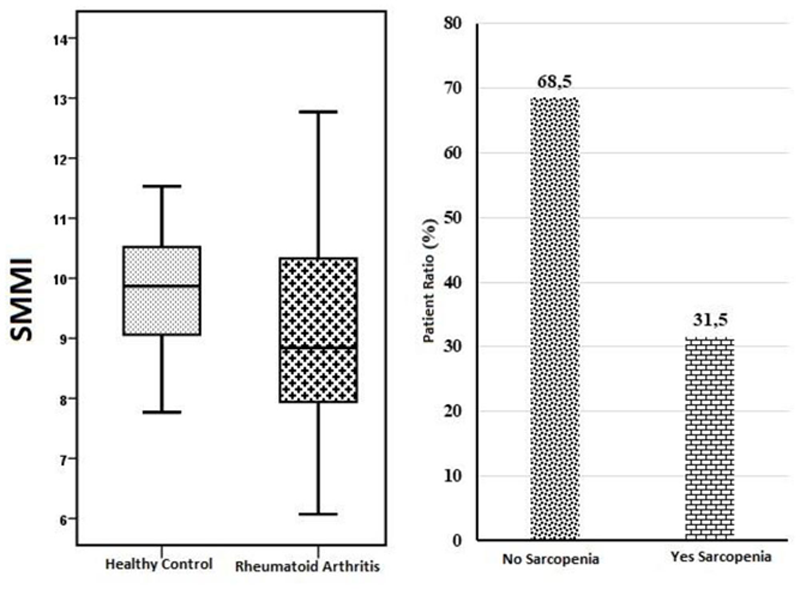
Results: Hand grip strength (p<0.001), skeletal muscle mass (p=0.009) and skeletal muscle mass index (p=0.032) were found to be reduced in RA patients compared to the control group. The frequency of sarcopenia in RA at onset of diagnosis was found to be 31.5%. There was a significant decrease in the rate of sarcopenia after three months of treatment (31.5% versus 8.7%; p=0.046).
Conclusion: Sarcopenia was found in approximately one third of the patients with newly diagnosed RA in our study. With treatment, sarcopenia improved significantly. RA patients should be evaluated in terms of sarcopenia besides evaluating joint and extra-articular findings at the time of diagnosis. Early detection and treatment planning may improve the quality of life.
Distribution of skeletal muscle mass index (SMMI) and prevalence of sarcopenia in RA and control groups
Demographics, clinical features, anthropometric measurementsand disease activity scores of sarcopenic and non-sarcopenic RA patients
|
RA without sarcopenia
|
RA with sarcopenia
| p | |
| Age, mean (SD), years | 47,3 (12,8) | 58,0 (16) | 0,011* |
| Gender, female, n (% ) | 27 (73) | 9 (52,9) | 0,215 |
| Marital status, married, n (% ) | 34 (91,9) | 13 (76,5) | 0,258 |
| Tobacco consumption, n (% ) | |||
| Active smoker | 10 (27) | 5 (29,4) | 0,086 |
| Ex-smoker | 8 (21,6) | 8 (47,1) | |
| Never smoker | 19 (51,4) | 4 (23,5) | |
| Alcohol consumption, n (% ) | |||
| Active drinker | 2 (5,4) | 2 (11,8) | 0,244 |
| Ex-drinker | 0 (0,0) | 1 (5,9) | |
| Never drinker | 35 (94,6) | 14 (82,4) | |
| Occupation, n (% ) | |||
| Worker | 15 (40,5) | 12 (70,6) | 0,060 |
| Height, mean (SD), meter | 1,6 (0,1) | 1,6 (0,1) | 0,664 |
| Weight, mean (SD), kg | 80,6 (17,7) | 65,3 (8,6) | <0,001* |
| BMI, mean (SD), kg/m 2 | 31,4 (7,3) | 24,9 (3,2) | <0,001* |
| Obese, n (% ) | 20 (54,1) | 2 (11,8) | 0,006* |
| Waist circumference, mean (SD), cm | 97,1 (14,2) | 89,3 (12,8) | 0,058 |
| Hip circumference, mean (SD), cm | 108,1 (12,7) | 96,6 (5,1) | 0,001* |
| Calf circumference, mean (SD), cm | 35,4 (5,1) | 29,6 (4,0) | <0,001* |
| Triceps skin thickness, median (min-max), mm | 22 (8-36) | 15 (6-31) | 0,022* |
| Loss of muscle strength, n (% ) | |||
| Right | 10 (27,0) | 9 (52,9) | 0,076 |
| Left | 12 (32,4) | 10 (58,8) | 0,081 |
| Dominant hand, right, n (% ) | 33 (89,2) | 13 (76,5) | 0,418 |
| SMM, mean (SD ) | 25,1 (5,8) | 21,9 (4,7) | 0,049* |
| SMMI, mean (SD ) | 9,6 (1,5) | 8,2 (1,2) | <0,001* |
| DAS 28 - CRP, median (min-max ) | 4,4 (1,7-6,5) | 4,4 (2,4-6,3) | 0,860 |
| SDAI, median (min-max ) | 36,1 (8,8-113) | 31,1 (17,1-113) | 0,668 |
| CDAI, median (min-max ) | 23 (0-48) | 23 (6-39) | 0,993 |
| PrGA, median (min-max ) | 6 (0-9) | 5 (2-10) | 0,627 |
| PtGA, median (min-max ) | 8 (0-10) | 7 (4-10) | 0,666 |
| Presence of morning stiffness, n (% ) | 32 (86,5) | 14 (82,4) | 0,999 |
| Swollen joint count, median (min-max ) | 2 (0-10) | 4 (0-9) | 0,423 |
| Tender joint count, median (min-max ) | 6 (0-20) | 7 (0-18) | 0,911 |
Disclosure of Interests: None declared