fetching data ... 
Background: Moderate to Severe Plaque Psoriasis is an inflammatory skin disease that is associated with multiple comorbidities and substantially diminishes patients’ quality of life. As one of the most significant therapeutic advancements in the field of dermatology, Biologics such as TNF inhibitors, IL-12/23 inhibitor, IL-17 inhibitors, and IL-23 inhibitors, have higher efficacy compared with oral medications or phototherapy 1 . However, the previous studies did not focus on the simultaneous comparison of molecular changes in different classes of biologics. The identification of time-series genes (TSGs) could help to uncover the mechanisms underlying transcriptional regulation 2 .
Objectives: In this study, we aimed to compare the differences in expression patterns and functions of time-series genes in Moderate to Severe Plaque Psoriasis under different biologics treatments.
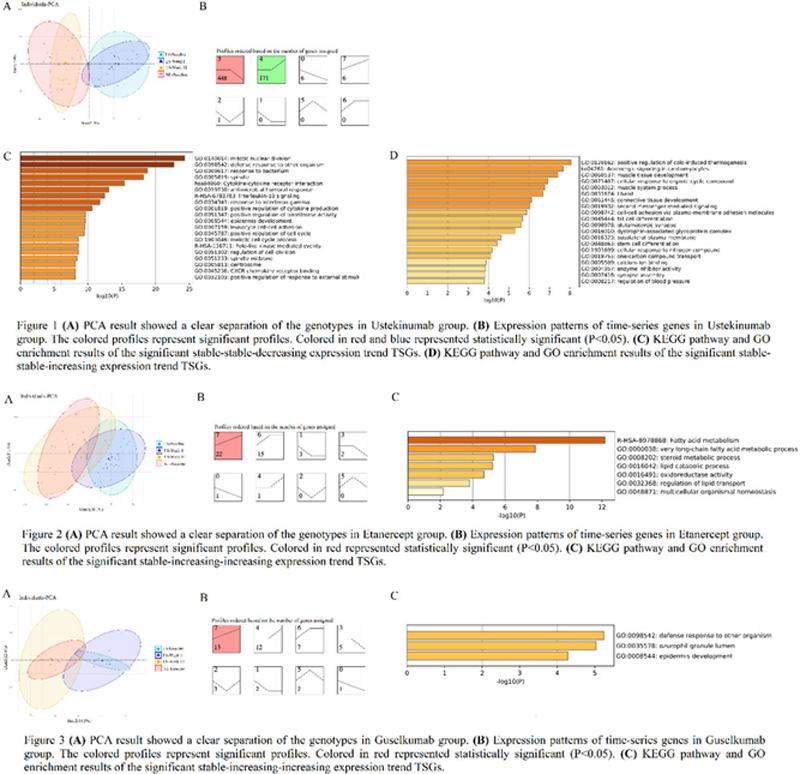
Methods: The transcription profile of GSE117239 and GSE51440 were obtained from the Gene Expression Omnibus database (GEO). The GSE117239 included 19 samples treated with Etanercept (TNF inhibitors) and 16 samples treated with Ustekinumab (IL-12/23 inhibitor). The GSE51440 included 4 samples treated with Guselkumab (IL-23 inhibitors). Skin biopsy samples (LS: lesion, NL: non-lesion) were collected at baseline, weeks 1 and 12, respectively. After background adjustment and other pre-procession, differentially expressed genes (DEGs) were extracted from LS skin biopsy and untreated NL skin biopsy at different times after three different biologics treatments, respectively. The Short Time-series Expression Miner (STEM) software was used to cluster and compare average DEGs with coherent changes. Afterward, the different expression patterns of TSGs under the three treatment groups were compared. GO analysis and KEGG pathway enrichment analysis of TSGs were performed by Metascape.
Results: Different DEGs varied in LS skin compared with those of NL skin biopsy: 976 genes in Ustekinumab group, 996 genes in Etanercept group, and 601 genes in Guselkumab group detailly (
P
< 0.05 and [log FC] > 1). Gene landscapes suggested the signatures of LS gradually changed during the treatment process, and gradually converge to NL signatures (
Conclusion: Biologics effectively reconstituted the gene signatures of psoriasis in different aspects. TSG features could be one of indicator for precise intervention for psoriasis.
REFERENCES:
[1]Armstrong AW, Read C. Pathophysiology, Clinical Presentation, and Treatment of Psoriasis: A Review. Jama 2020;323(19):1945-60. doi: 10.1001/jama.2020.4006 [published Online First: 2020/05/20]
[2]Ernst J, Bar-Joseph Z. STEM: a tool for the analysis of short time series gene expression data. BMC Bioinformatics 2006;7:191. doi: 10.1186/1471-2105-7-191 [published Online First: 2006/04/07]
Acknowledgements: This project was supported by National Science Foundation of China (82001740), Open Fund from the Key Laboratory of Cellular Physiology (Shanxi Medical University) (KLCP2019) and Innovation Plan for Postgraduate Education in Shanxi Province (2020BY078).
Disclosure of Interests: None declared