fetching data ... 
Background: Given the different symptom duration at first presentation of patients who are developing rheumatoid arthritis, we hypothesize that patients progress towards RA at a different speed, possibly going through different clinical stages. By identifying those stages and the pace at which patients transition from one to the other we could get a better understanding of the disease course as well as define a better timing for medical intervention.
Objectives: To identify clinically distinct disease stages and trajectories within Rheumatoid Arthritis.
Methods: We used clinical data (ESR, TJC, MCH, MCHC, MCV, leukocytes, thrombocytes, hemoglobin, and hematocrit) of 1595 outpatient visits in the first one and a half years of treatment of 426 patients. To facilitate trajectory comparison, we normalized data per patient. Building on previous work in the single-cell analysis field, we employed the Seurat 1 pipeline running an unsupervised cluster analysis in the higher dimensions using the SLM (smart logical moving) algorithm. Different baseline definitions were explored; the date of first visit, RA diagnosis, and DMARD initiation. Using these different baselines we can examine whether a cluster contains mostly late or early visits.
Results: Using only clinical variables, we identified eleven distinct clinical clusters that represent early, mixed, and late clinical visits (
Violin plots for the different baselines. A) tSNE plot color indicating cluster, B) baseline defined by first clinic visit, C) baseline is RA diagnosis, D) baseline is DMARD initiation. The colors correspond to the different clusters. (y-axis: days since baseline, x-axis: cluster)
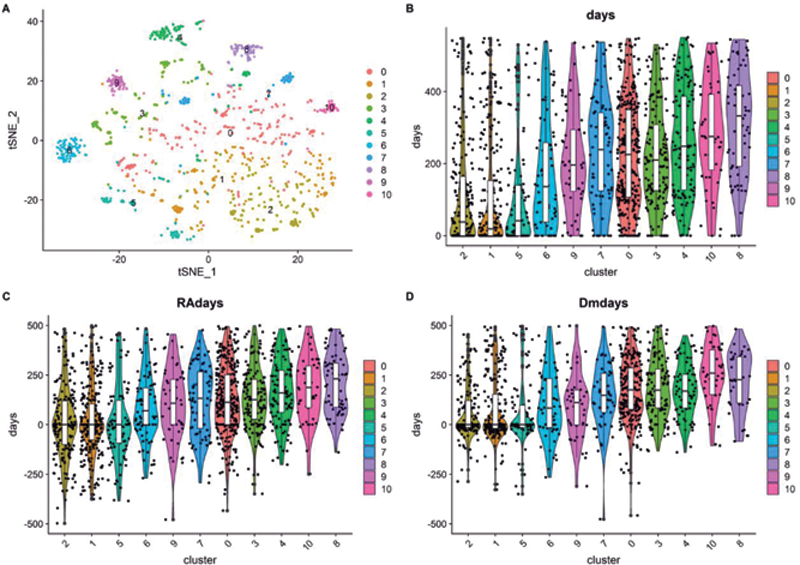
For each patient, we also had access to the number of days relative to the date of the first visit, RA diagnosis, and DMARD initiation that the different samples were taken from. Using this information we can show that some clusters are enriched for late time points while others are enriched for early time points (
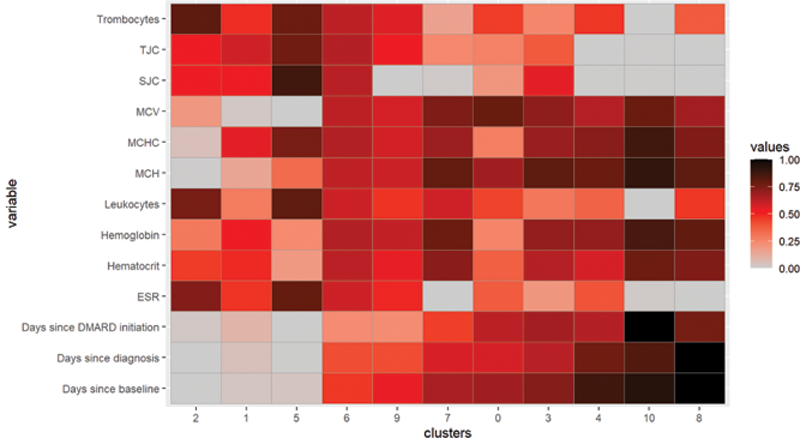
Considering the clinical values in the different clusters showed a lower disease activity in the later clusters than in the earlier clusters (
Interpreting the clusters and their values. ESR, Erythrocyte Sedimentation Rate; SJC, Swollen Joint Count; TJC, Tender Joint Count
Conclusion: With unsupervised clustering on clinical parameters, we can differentiate early and late outpatient visits even when the duration between first visit and RA diagnosis or DMARD initiation differed. Subsequently, the clustering identified different clinical groups amongst the first and later clinical visits. Our analysis is the first step into defining disease trajectories in patients who develop RA and represents a new way to integrate longitudinal patient data. The next step is to explore whether patients follow different trajectories.
REFERENCES:
[1]Paul Hoffman, Satija Lab, and Collaborators; Seurat 4.0;
Acknowledgements: This project has received funding from the Innovative Medicines Initiative 2 Joint Undertaking under grant agreement No 777357, RTCure.
Disclosure of Interests: Daan van der Bijl: None declared, Tjardo Maarseveen: None declared, Andrew Cope Speakers bureau: Abbvie, BMS, Consultant of: Abbvie, BMS, Galvani/GSK, UCB, Janssen, Grant/research support from: BMS, UCB, Abraham Yann Employee of: Janssen Pharmaceutical Companies of Johnson & Johnson, Rachel Knevel Grant/research support from: Pfizer.