fetching data ... 
Background Gout is caused by depositions of monosodium uric acid crystals in joints and tissues which triggers highly painful flares. Serum urate lowering treatment (ULT) reduces the number of flares.
Objectives To explore the change of crystal depositions assessed by ultrasound and dual energy computer tomography (DECT) for two years, and the associations between depositions and occurrence of flare during the first year of ULT.
Methods Patients with crystal-proven gout who presented themselves after a recent gout flare and with serum uric acid (sUA) level (>360 μmol/L) were consecutively included (the NOR-Gout study (1,2)). They were followed monthly if needed with increase of ULT to achieve sUA <360 μmol/L (or <300 μmol/L if clinical tophus) as well as flare prophylaxis for 3-6 months. The patients were assessed clinically and by laboratory tests. Information about flares before the visit was collected (numbers year 1, only occurrence year 2). A comprehensive ultrasound assessment (General Electric E9) at baseline, 12 and 24 months was performed using semi-quantitative scoring of MSU depositions (using definitions and scoring system defined by OMERACT of double contour (DC), tophi and aggregates), and examination of bilateral radiocarpal, MCP 2 and MTP 1 joints, triceps, and quadriceps insertions, patellar (proximal and distal) and Achilles tendons as well as distal femur (maximal flexed knee) and talar cartilage). In addition, DECT (General Electric Discovery CT750 HD) of both feet were performed. Total sum scores of US depositions (DC, tophi and aggregates) or DECT depositions were calculated, as well as US sum scores only of the feet for comparison with DECT. Comparisons were performed by Wilcoxon or Mann-Whitney. Logistic regression explored if flare occurring during 0-3 or 0-12 months was predicted by US or DECT (controlling for age, sex, disease duration and presence of clinical tophus).
Results 209 patients were included (mean (SD) age 56.4 (13.8) years, time since first flare (disease duration) 7.9 (7.7) years, 95.5% men). During year 1 and 2 patients with flares compared with no flares had higher baseline US and DECT scores (p<0.05). The total sum scores of US (DC, tophi and aggregates) and DECT decreased during the study (p<0.001 for all, table 1). Figure 1 shows the parallel decrease of depositions in feet by US and DECT (all changes p<0.001). During the first year there were median (range) 2 (0-14) flares. At least one flare was seen in 81% the first year, but only in 26% the second year. Baseline total US sum scores predicted flare the first 3 months (DC; p=0.031, β=0.113, total sum score; p=0.047, β=1.026) and baseline DECT predicted flare both at 3 and 12 months (p=0.014, β=1.086 and p=0.010, β=1.193, respectively).
Conclusion Baseline levels of US and DECT depositions were higher in patients having flare during the study. The amount of crystal depositions in both imaging modalities decreased substantially during ULT as did occurrence of flare. Baseline US and DECT depositions predicted flare during follow-up. Thus, patients should be encouraged to follow a treat-to-target procedure of sUA reduction to reduce both depositions and flares.
References
Image/graph:
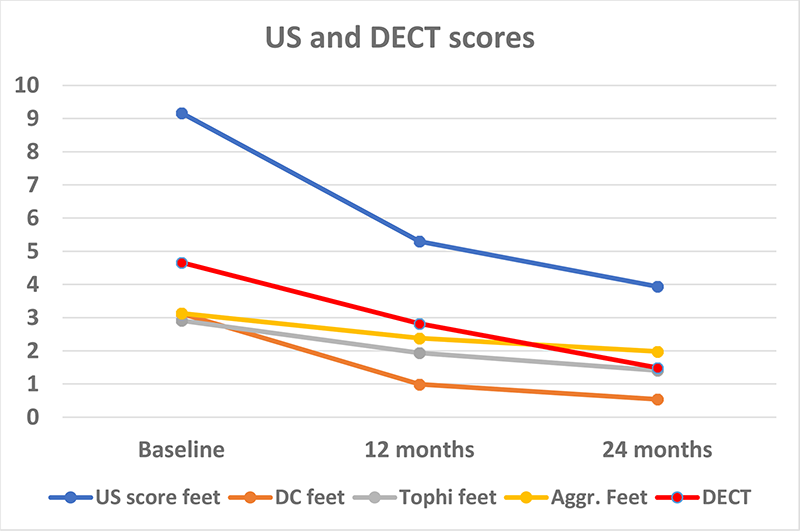
Figure 1. Ultrasound scores and DECT only from the feet
| Sum scores | Baseline | 12 months | 24 months |
|---|---|---|---|
| Ultrasound - Double contour | 4.3 (3.5) | 1.3 (2.2) | 0.7 (1.4) |
| Ultrasound – Tophi | 6.5 (6.5) | 3.8 (5.2) | 2.4 (3.7) |
| Ultrasound - Aggregates | 9.3 (5.6) | 6.7 (5.1) | 5.5 (4.7) |
| Ultrasound –Double contour, Tophi, Agregates | 20.0 (13.9) | 11.7 (11.3) | 8.6 (8.8) |
| Dual energy computer tomography (DECT) | 4.7 (6.4) | 2.8 (4.8) | 1.5 (3.2) |
Acknowledgements: NIL.
Disclosure of Interests Hilde Berner Hammer Speakers bureau: AbbVie, Novartis, UCB, Lilly, Paid instructor for: Novartis, UCB, Consultant of: AbbVie, Novartis, Grant/research support from: AbbVie, Pfizer, Roche, Lars Fridtjof Karoliussen: None declared, Tron Eskild: None declared, Joe Sexton: None declared, Lene Terslev Speakers bureau: Novartis, Janssen, Lilly, UCB and Roche, Espen A Haavardsholm Speakers bureau: Pfizer, UCB, Eli Lilly, Celgene, Janssen-Cilag, AbbVie and Gilead, Till Uhlig Speakers bureau: Grünenthal and Novartis.
Keywords: Imaging, Gout, Ultrasound
DOI: 10.1136/annrheumdis-2023-eular.406