
Background: Tumour Necrosis Factor inhibitors (TNFi) like adalimumab, are key in treating rheumatoid arthritis (RA). However, ~30% of patients show inadequate response. Identifying surrogate biomarkers of a positive adalimumab response would facilitate precision medicine strategies and improve patient outcomes.
Objectives: To identify blood-based transcriptomic biomarkers of adalimumab response in patients with RA.
Methods: Whole blood samples were taken from RA patients participating in the Biologics in Rheumatoid Arthritis Genetics and Genomics Study Syndicate (BRAGGSS), a UK based observational longitudinal cohort of RA patients undergoing biologic treatment. RNA-seq on the Illumina NovaSeq 6000 was generated on patients pre- and post-3 months of adalimumab treatment. Treatment response was determined after 6 months of treatment and patients were classified as good (both good & moderate) or non-responders using EULAR response criteria. Differential gene expression analysis was performed using glmmSeq, with interaction between response and timepoint with random effects per patients. Differentially expressed genes, determined with an FDR < 0.05 for both interaction and response to treatment, were used as input for classification modelling with Random Forest (RF) predicting response outcome. RF classifier was evaluated using nested 10-fold cross-validation, using an inner 5-fold loop for hyperparameter tuning. Different models were trained using data from each time point separately and in combination. RF evaluations were performed using area under the receiver operating curve (AUC). Trained models were interpreted minimal relative importance (MRI) of features, and features with >1% MRI were used for network construction using graphical lasso. Networks for good and non-responders were constructed for baseline and follow-up. Functional enrichment was conducted using Metascape.
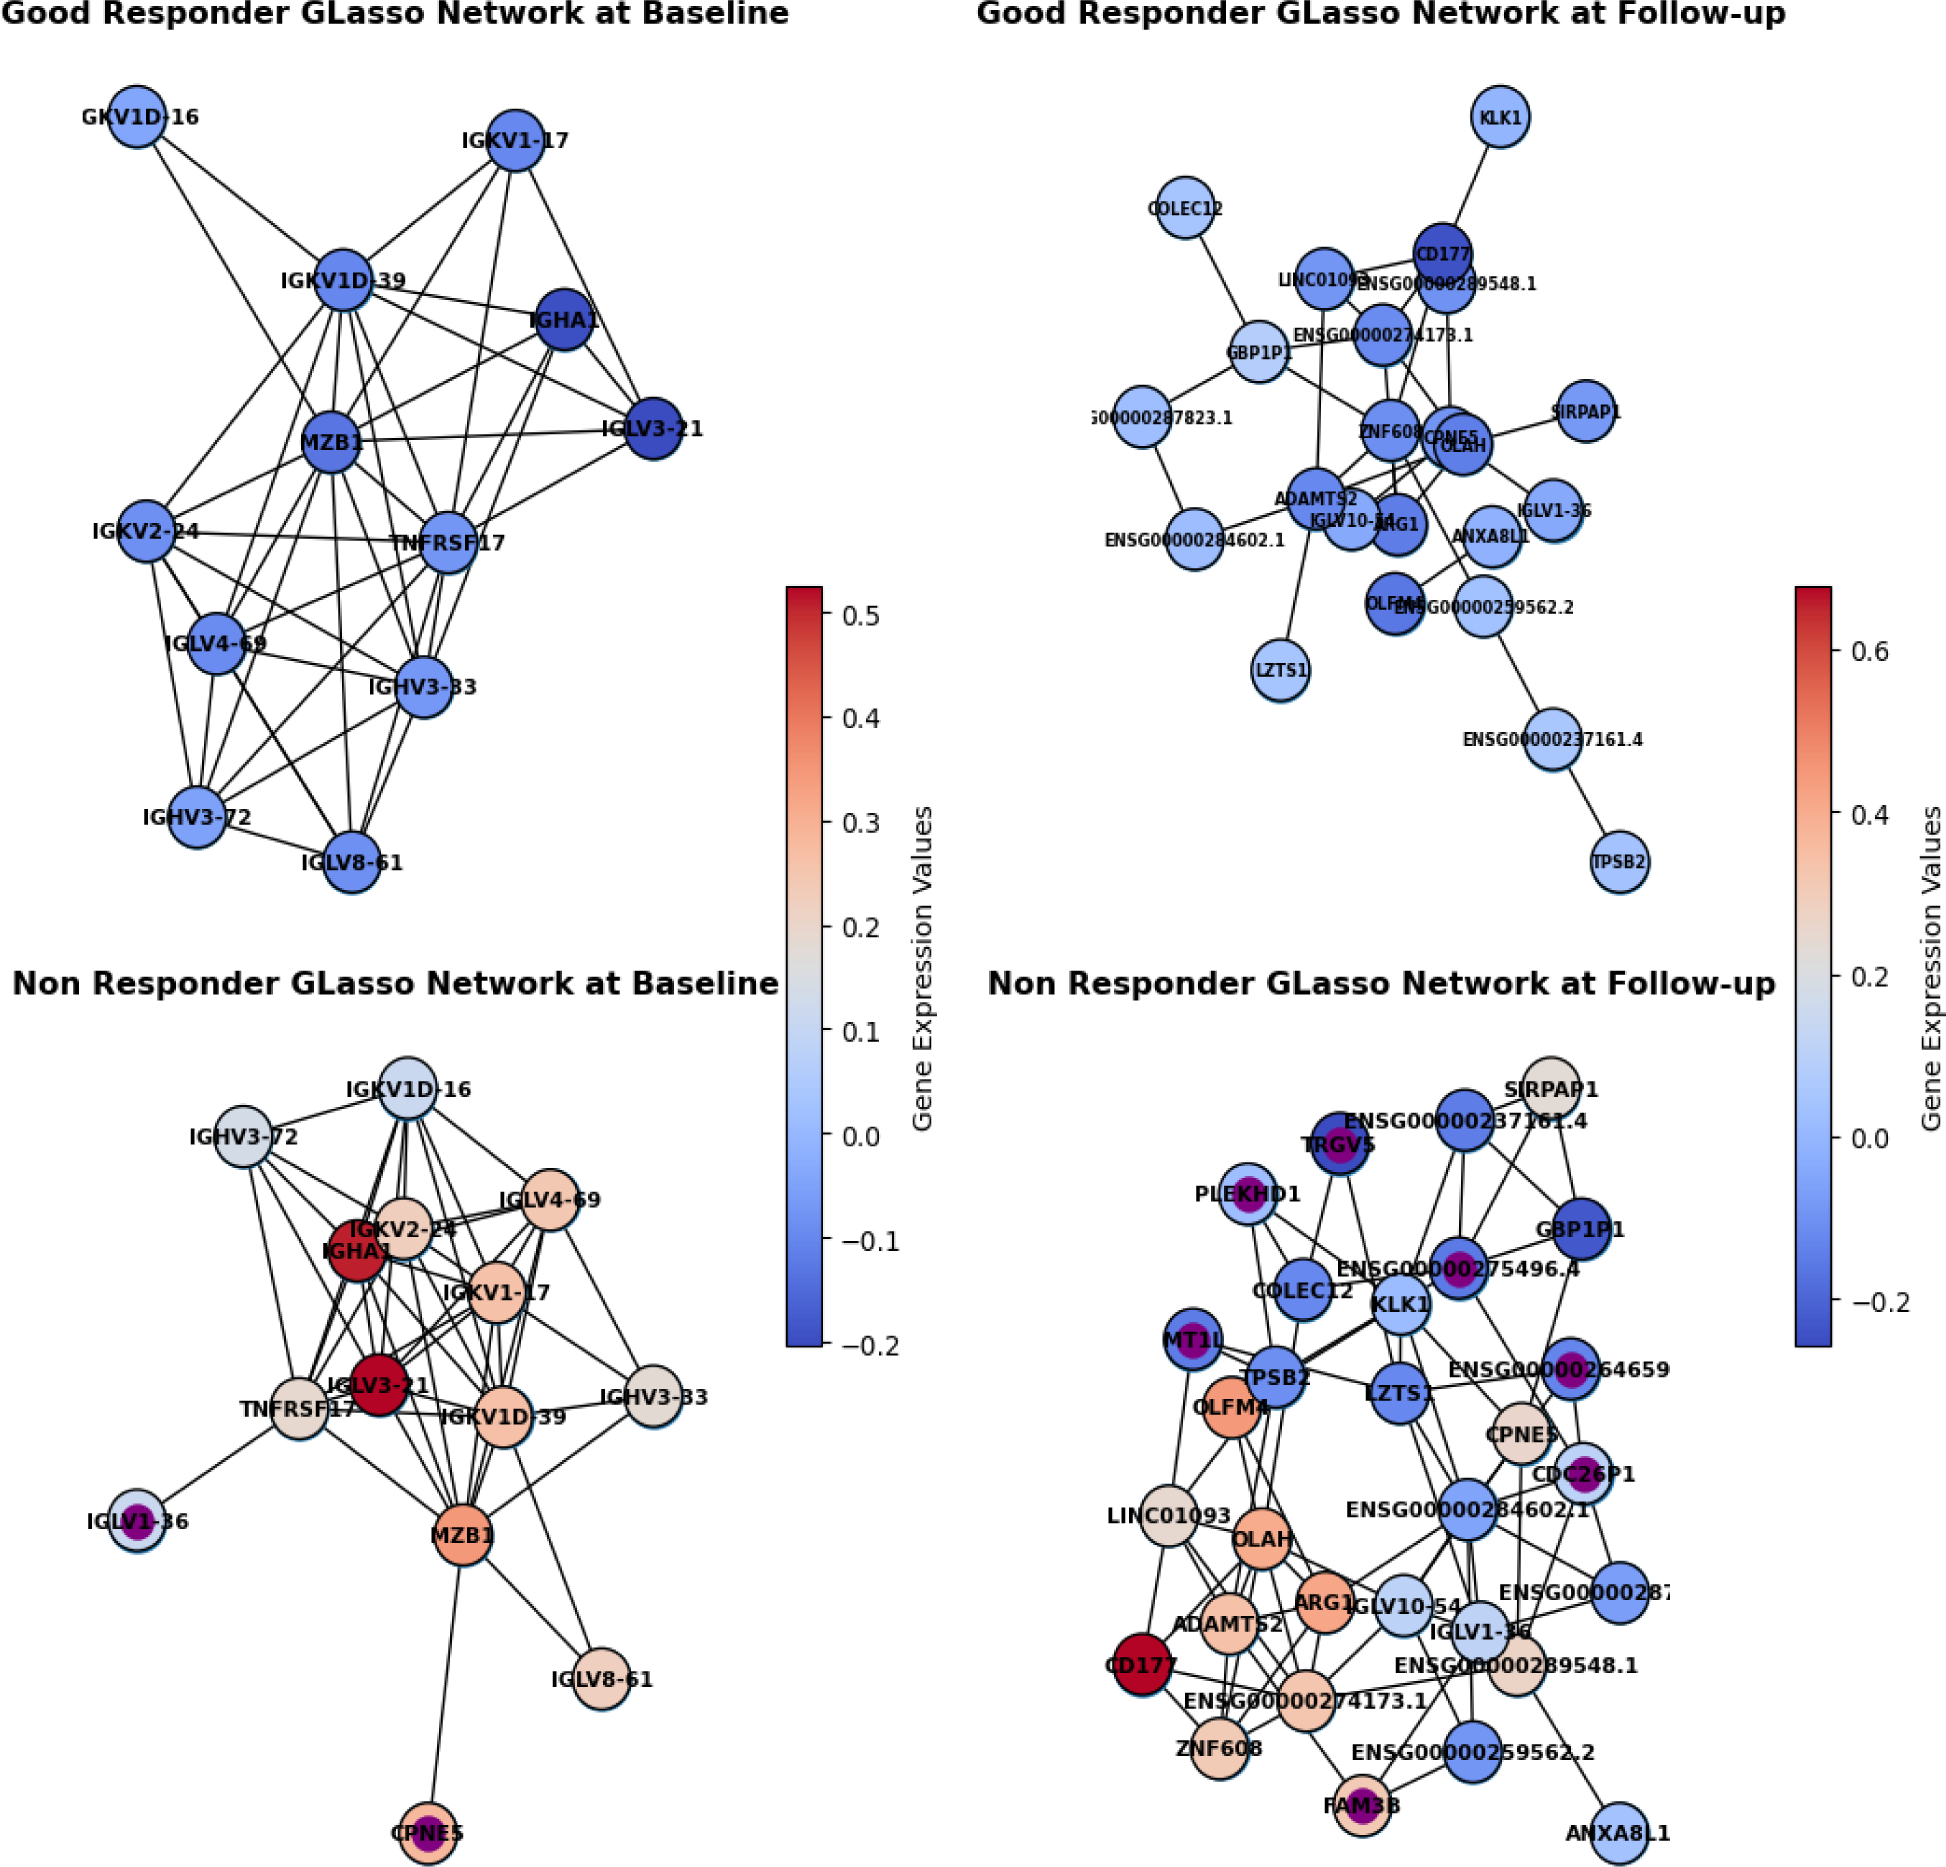
Results: 100 patients at two time points (72 good-responders and 28 non-responder) were included in the analysis. Post quality control, differential expression analysis was conducted on 16,541 genes, 84 genes showed significant differential expression. Random Forest models trained on both time-points combined did not result in a predictive model (mean AUC of 0.55). However, when a model was built for each time-point separately, mean AUC above 0.8 was achieved for both models in predicting response. The most informative genes for both time-points were selected based on MRI and were used to retrain the model on all data. The retrained model achieved an AUC of 0.86 ± 0.13 for baseline data and 0.82 ± 0.15 for data at 3-months. Good responders at baseline exhibited under-expression of immune-related genes compared to non-responders. Conversely, in the follow-up model, patients displayed differential regulation primarily associated with innate immune responses. At both time-points, the network’s connected component for non-responders exhibited higher connectivity and contained nodes not found in good-responders (Figure 1). At baseline, CPNE5 was found only in non-responder’s network. This is a calcium-dependent phospholipid binding protein, which exhibited connectivity with MZB1, a gene involved in B-cell development and antibody production. In the post-treatment network, the most informative gene, TRGV5 (T-cell Gamma Receptor Variable 5) was present only in non-responder’s network, which displayed connections to COLEC12, implicated in innate immune responses. Both TRGV5 and COLEC12 showed upregulation in good responders. Notably, TRGV5 was also connected to LZTS1, a gene believed to function as a tumour suppressor.
Conclusion: Analysis of whole blood transcriptomics reveals biomarkers underlying adalimumab response in RA, emphasizing immune activity’s vital role. These findings highlights potential for precision medicine in RA, now require external validation.
REFERENCES: NIL.
Connected component of networks for both time-points and response groups. Nodes are coloured by mean relative gene expression, where blue is lower mean expression and red is higher mean expression. Nodes found only in non-responders are marked with purple centre.

Acknowledgements: 3TR, BRAGGSS, NIHR Manchester BRC.
Disclosure of Interests: Chuan Fu Yap: None declared, Nisha Nair: None declared, Kimme Hyrich Abbvie, Pfizer and BMS, Anthony G Wilson: None declared, John Isaacs: None declared, Ann Morgan: None declared, Anne Barton: None declared, Darren Plant: None declared.