
Background: To fulfil the energy demands upon activation, lymphocytes undergo a profound metabolic reprogramming (i.e switch towards glycolysis), which sustains their pro-inflammatory function. This concept, which is known under the term “immune-metabolism” [1], has become of great interest in rheumatic diseases; however, little is known in Sjogren Disease (SD). As infiltrating T and B cells forming aggregates (named foci) are the hallmark of SD and display a major pathogenic role, investigating the contribute of metabolic reprogramming, especially glycolysis, in these cells looks particularly relevant.
Objectives: Aim of this study is to evaluate the expression of the glucose transporter marker GLUT-1 in lymphocytes infiltrating SD minor SG and to assess its correlation with the severity of inflammatory infiltrates.
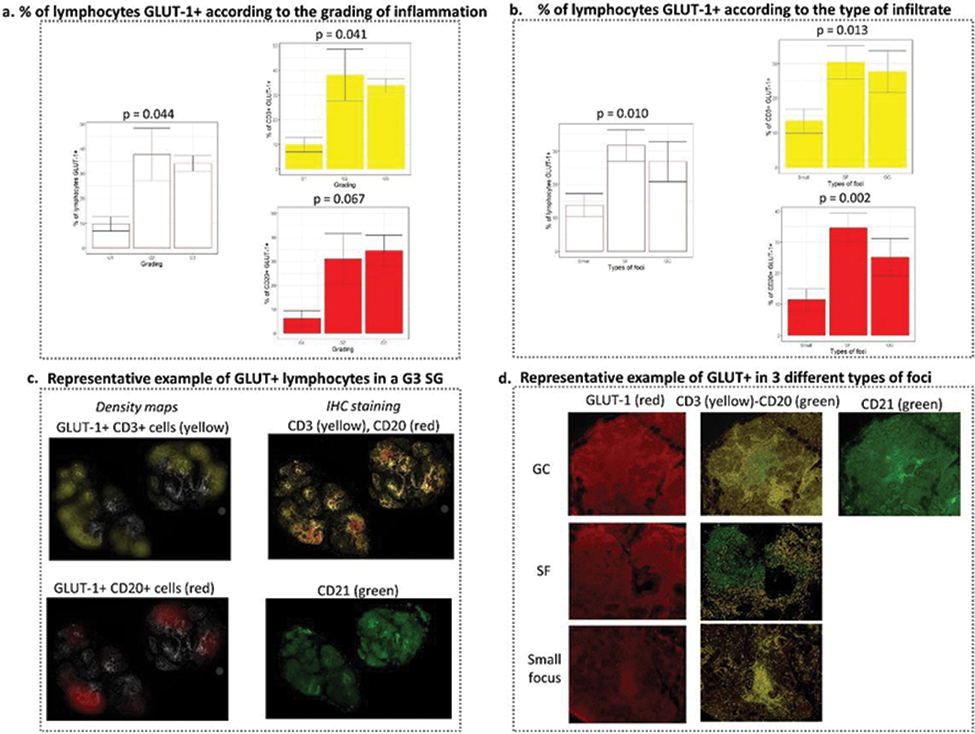
Methods: The expression of GLUT-1 on CD3+ and CD20+ lymphocytes infiltrating minor SG from patients with SD, has been evaluated by IFI in 9 different biopsies samples. Biopsies were divided in three groups according to composition and the level of organization of the foci:
G1: small foci mainly composed by CD3+ cells ( Small ) (n=3)
G2: large foci segregated in CD3+ and CD20+ areas [Segregated Foci ( SF )] (n=3)
G3: large SF with CD21+ staining indicative of Germinal Center like structures ( GC ) (n=3)
The quantification of the expression of GLUT-1 on lymphocytes was performed by digital imaging analysis (DIA) with QuPath software. GLUT-1 expression was quantified overall and selectively on CD3+ or CD20+ lymphocytes. To visualize SG areas with the highest expression of GLUT-1, density-maps were generated. Analysis of variance (ANOVA) and pairwise comparisons (Bonferroni correction) were performed to evaluate differences in the expression of GLUT-1 both according to the grading of inflammation (G1-G2-G3) and according to the type of foci ( Small-SF-GC ).
Results: Across the three groups (G1-G2-G3), a remarkably different GLUT-1 expression on infiltrating lymphocytes was detected ( Figure 1a ). Despite the evident increase from G1 to both G2 and G3, statistical significance was not achieved in pairwise comparisons [G1 (9,6%±3,8) vs G2 (37,7%±13,7), p=0.069; G2 vs G3 (34,1%±3,7), p=1]. The selective analysis for CD3+ and CD20+ cells showed similar results. Compared to G3, in G1 and G2 CD20+ cells showed a slightly lower rate of GLUT-1 ( Figure 1a ). Across the three types of foci, GLUT-1 expression on lymphocytes also significantly differed ( Figure 1b ). In pairwise comparison a significant difference between Small (13,7%±11,8) and SF (31,7%±17,9)(p=0.008) was detected while significancy was not reached in Small vs GC (26,8%±11,7)(p=0.338) and SF vs GC (p=1) ( Figure 1b ). Similar results were obtained when CD3+ and CD20+ cells were analysed separately ( Figure 1b ). Representative images of GLUT-1 density-maps in the G3 group and GLUT-1 expression in the different types of infiltrates are reported in Figure 1c-d .
Conclusion: This is the first study identifying the expression of the glycolysis marker GLUT-1 on both T and B lymphocytes infiltrating SD SG. An increase in GLUT-1+ lymphocytes was detected according to the severity of inflammation and reached the highest levels in large, organized foci. Despite preliminary, our findings suggest that activation of glucose metabolism may be associated with tissue lymphocytes activation and proliferation. Validation studies on a larger sample size are ongoing to confirm these findings and further investigate the role of glycolysis in SD infiltrating lymphocytes.
REFERENCES: [1] O’Neill LA, Kishton RJ, Rathmell J. A guide to immunometabolism for immunologists. Nat Rev Immunol. 2016 Sep;16(9):553-65

Acknowledgements: NIL.
Disclosure of Interests: None declared.