fetching data ... 
Background: Sacral magnetic resonance imaging (MRI) helps determine whether patients with axial spondyloarthritis (axSpA) have active disease by detecting sacroiliitis. However, there is no consensus on the extent to which sacroiliitis indicates active disease. Given the ambiguity in determining disease activity using MRI, we planned that this study would be helpful in clinical practice for predicting disease activity using artificial intelligence (AI) in patients with axSpA.
Objectives: We aimed to generate an AI model to predict disease activity in patients with axSpA using a multimodal model of sacral MRI and laboratory results.
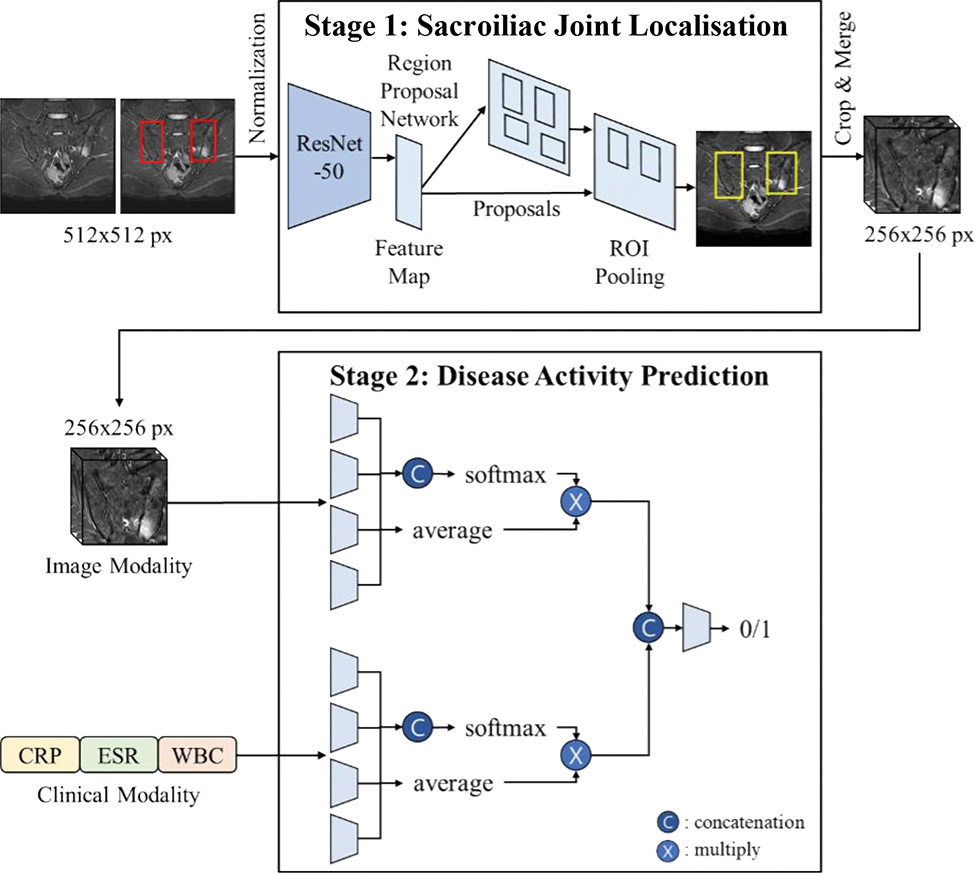
Methods: This retrospective study included sacral MRI of patients with chronic back pain for sacroiliac joint (SIJ) localisation, and only patients with axSpA for disease activity prediction. We propose a two-stage deep-learning framework that combines an SIJ localisation network with a disease-activity classification network (Figure 1). First, the Faster R-CNN network extracts regions of interest (ROIs) to localise the SIJs using whole MRI images. Disease activity was assessed based on 3D MRI volumes of localised ROIs using a multimodal deep learning framework. The multimodal network comprised a 2D-based neural network for clinical modality, which consisted of the ESR, CRP, and WBC counts, and a 3D-based convolutional neural network for image modality. Because the image and clinical modalities are weighted equally using the conventional feature fusion module, we propose an adaptive weighting feature fusion strategy with an attention mechanism to measure the importance of each modality. The presence or absence of disease activity in each patient was clinically labelled based on a combination of symptoms and laboratory tests. We compared the performance of the proposed method (Method D) with disease activity prediction using only the clinical modality (Method A), only the image modality (Method B), and a multimodal framework with a conventional feature fusion strategy (Method C). The performances were obtained by averaging five performances using a five-fold cross-validation.
Results: A total of 296 participants with 4,746 MRI images were included in the SIJ localisation experiments. The average intersections over the unions of the predicted results were 74.23% and 74.37% for the right and left SIJs, respectively, and the predicted ROIs covered most of the SIJs. In total, 126 participants were included in the disease activity prediction experiments. The mean area under the receiver operating characteristic curve, sensitivity, and specificity for the prediction of disease activity of the proposed multimodal prediction model (Method D) were 0.77 (95% CI, 0.72–0.82), 0.80 (95% CI, 0.79–0.82), and 0.74 (95% CI, 0.72–0.75). The performance of disease activity prediction improved gradually from neural networks directly on the clinical modality (Method A) or image modality (Method B) by implementing a multimodal deep learning network (Method C) and further by adding an adaptive weighting feature fusion strategy (Method D, Table 1).
Conclusion: This is the first AI prediction model for axSpA disease activity that uses MRI data. Although we were able to generate a prediction model for disease activity with high specificity using imaging modality alone, we could improve the prediction model in addition to the multimodal prediction process. This study demonstrates the potential of AI models to aid in determining disease activity in clinical practice.
REFERENCES: NIL.
Overview of a two-stage deep-learning framework for predicting disease activity in patients with axial spondyloarthritis.
Performances of artificial intelligence models for disease activity prediction in patients with axial spondyloarthritis
| AUROC
| Sensitivity
| Specificity
|
|
|---|---|---|---|
| Method A | 0.70 (0.65–0.75) | 0.73 (0.71–0.75) | 0.67 (0.66–0.69) |
| Method B | 0.69 (0.63–0.74) | 0.57 (0.56–0.59) | 0.80 (0.79–0.81) |
| Method C | 0.72 (0.67–0.77) | 0.73 (0.71–0.75) | 0.71 (0.70–0.73) |
| Method D | 0.77 (0.72–0.82) | 0.80 (0.79–0.82) | 0.74 (0.72–0.75) |
AUROC, area under the receiver operating characteristic curve; CI, confidence interval.
Acknowledgements: This work was supported by the National Research Foundation of Korea (NRF) grants funded by the Korean Government (MSIT) (NRF-2021R1F1A1062148 and NRF-2022R1F1A1071471).
Disclosure of Interests: None declared.