
Background: Systemic Lupus Erythematosus (SLE) is a chronic autoimmune disease characterized by the production of autoantibodies and inflammation that can affect multiple organs and systems within the body. Patients with SLE are at risk for kidney damage due to different self-characteristics, underlying risk factors, and disease history, etc. Relevant machine learning modeling predictions will provide adequate support and reference information for the exploration of these potential factors.
Objectives: The primary objective of this study is to predict potential key determinants affecting kidney involvement in SLE patients through comprehensive machine learning modeling.
Methods: This study employs a machine learning approach to predict kidney involvement in patients with systemic lupus erythematosus (SLE). The dataset underwent preprocessing to address missing values, including imputation and dummy coding for categorical variables. And data was split into an 80% training set and a 20% testing set, with stratification to balance the outcome variable.
The study used the “lightgbm” package within the tidymodels framework (by R software) to tune a gradient boosting model, optimizing for area under the curve (AUC). Cross-validation with five folds was performed to evaluate model performance and determine optimal hyperparameters. The final model was selected based on the highest AUC.
Results: The study included 1029 participants, consisting of 121 males and 908 females, with a mean age of 28.0 (23.0-39.5) years and a median disease duration of 1.0 year (ranging from 0.5 to 4.0 years). Overall, 333 of these patients developed kidney involvement. Notably, there were no significant differences observed in age, age at onset, and disease duration between male and female patients with systemic lupus erythematosus (SLE).
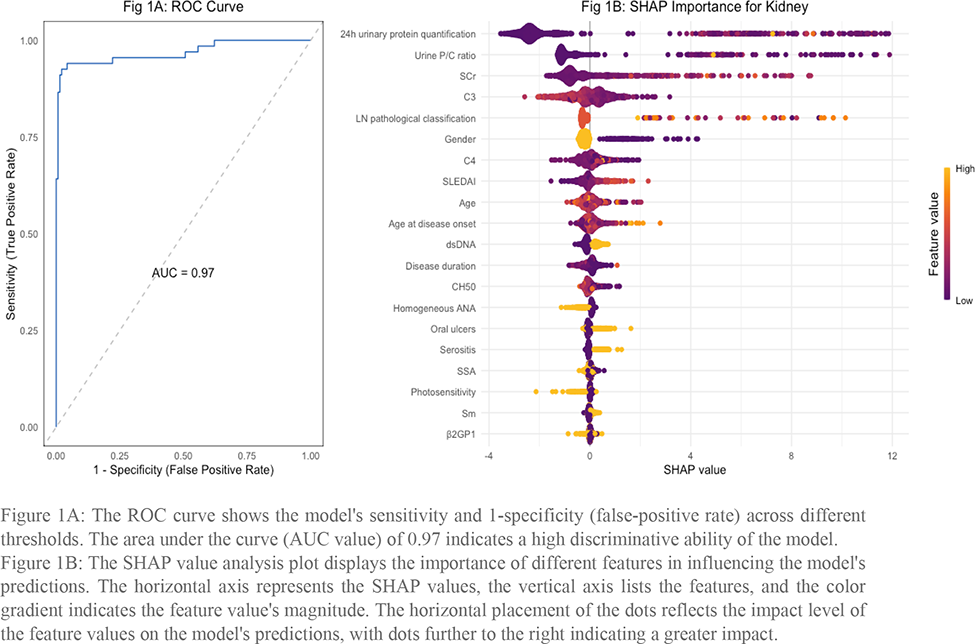
The optimized gradient boosting model demonstrated high predictive performance with an AUC of 0.97, indicating excellent discrimination between SLE patients with and without kidney involvement. The ROC curve plotted emphasizes the model’s sensitivity and specificity across different thresholds. Furthermore, the SHAP value analysis revealed the most influential features, with 24h urine protein quantification, urine protein/creatinine ratio, and higher Scr being the top contributors.
Conclusion: In this analysis, the key determinants for kidney involvement in SLE are identified as urinary protein metrics, serum creatinine, complement levels, and SLEDAI scores. These findings highlight the intricate relationship between clinical and laboratory indicators in managing and forecasting renal outcomes in SLE patients.
REFERENCES: NIL.
The ROC curve shows the model’s sensitivity and 1-specificity (false-positive rate) across different thresholds. The area under the curve (AUC value) of 0.97 indicates a high discriminative ability of the model.
Figure 1B. The SHAP value analysis plot displays the importance of different features in influencing the model’s predictions. The horizontal axis represents the SHAP values, the vertical axis lists the features, and the color gradient indicates the feature value’s magnitude. The horizontal placement of the dots reflects the impact level of the feature values on the model’s predictions, with dots further to the right indicating a greater impact.

Acknowledgements: NIL.
Disclosure of Interests: None declared.