fetching data ... 
Background: Childhood-onset systemic lupus erythematosus (cSLE) is an autoimmune disease characterized by more severe clinical manifestations than adults. Heterogeneous disease warrants diverse clinical and laboratory criteria for diagnosis, which is challenging and an unmet need. To capture this inherent heterogeneity, a diagnostic model which reveals underlying mechanistic immune perturbations can augment current diagnostic criteria while imparting a theragnostic perspective to cSLE.
Objectives: We aim to resolve this immunopathogenic complexity with high-dimensional mass cytometry (CyTOF) to study the lupus immunome. Subsequently, machine learning was used to create a diagnostic model, which was validated with an independent cSLE cohort and utilized mechanistically relevant cell clusters differing significantly between patients and controls.
Methods: For discovery, peripheral blood mononuclear cells (PBMCs) from 26 cSLE patients (53 timepoints, median age: 14 years) and 17 age-matched healthy controls were studied with a 43-marker CyTOF panel. Quality check, cell clustering, phenotypic annotation based on marker expression and visualization were done using our unsupervised Extended Poly-dimensional Immunome Characterisation (EPIC) pipeline.[1] The discovery cohort data was used to create an immune map and cell clusters predictive of cSLE were identified with machine learning algorithms [linear SVM, PLS-DA, random forest (RF) using MetaboAnalyst 6.0] to ensure model robustness. Cell frequencies are shown as a percentage of total CD45 + PBMCs with median and interquartile range (IQR). Statistical significance is defined as p<0.05 (Mann-Whitney U). For validation, a new cohort of 18 cSLE patients (median age: 11.5) and 23 age-matched controls were interrogated with CyTOF using the same panel.
Results: Multiple immune cell derangements were noted between cSLE and healthy in the discovery cohort. 67 unique cell clusters were derived, of which 26 were significantly different. All 67 cell clusters were used to map the validation cohort. Mapping was automated based on previous expert annotation of the derived cell clusters from unsupervised analysis of discovery data. Figure 1 shows the positive results of similar phenotypes derived from this automated process. Interestingly, there were increased memory T regs in cSLE (cSLE vs. healthy: 1.16 [0.79-1.92]% vs. 0.48 [0.32- 0.80]%, p<0.0001) but no changes in naive T regs . A memory T reg -like population (CD3 + CD4 + CD45RO + CD25 - Foxp3 + CTLA + ) was also higher in cSLE than healthy (2.75 [1.90-4.36] vs. 1.28 [0.83-1.78], p<0.0001). Concurrently, a CD8 + CD45RA + BAFF + T-cell population was raised in cSLE (8.91 [6.78-11.4] vs. 3.22 [2.79-4.86], p<0.0001). These two populations, in addition to eight other unique cell clusters, were used to build a cSLE classification model. These ten immunological features were selected through collective ranking of the most important features generated by machine learning algorithms on discovery cohort data. The average accuracy of discriminating cSLE and healthy based on 100 cross validations (with linear SVM, PLS-DA and RF algorithms) in the discovery cohort is 85.4% (median, IQR 83.3-85.6%). Sensitivity for the validation cohort is 88.9% (83.3-100%). Further studies will quantitate autoantibody titers (anti-c1q/-nucleosome/-dsDNA/-Smith) for comparison.
Conclusion: High-dimensional and machine learning approaches were employed to create an immunological-based classifier model to discriminate between cSLE and healthy. The ten features reflect broad changes in the lupus immunome: perturbed immunoregulation, cytokine production and reduced immune activation threshold. This enhances our understanding of SLE immunopathogenesis and can reinforce current SLE diagnostic criteria.
REFERENCES: [1] Yeo, J.G. et al. , 2020. The EPIC web-based reference and discovery tool for cytometry data. Nat. Biotech. , 38(6), 679-684.
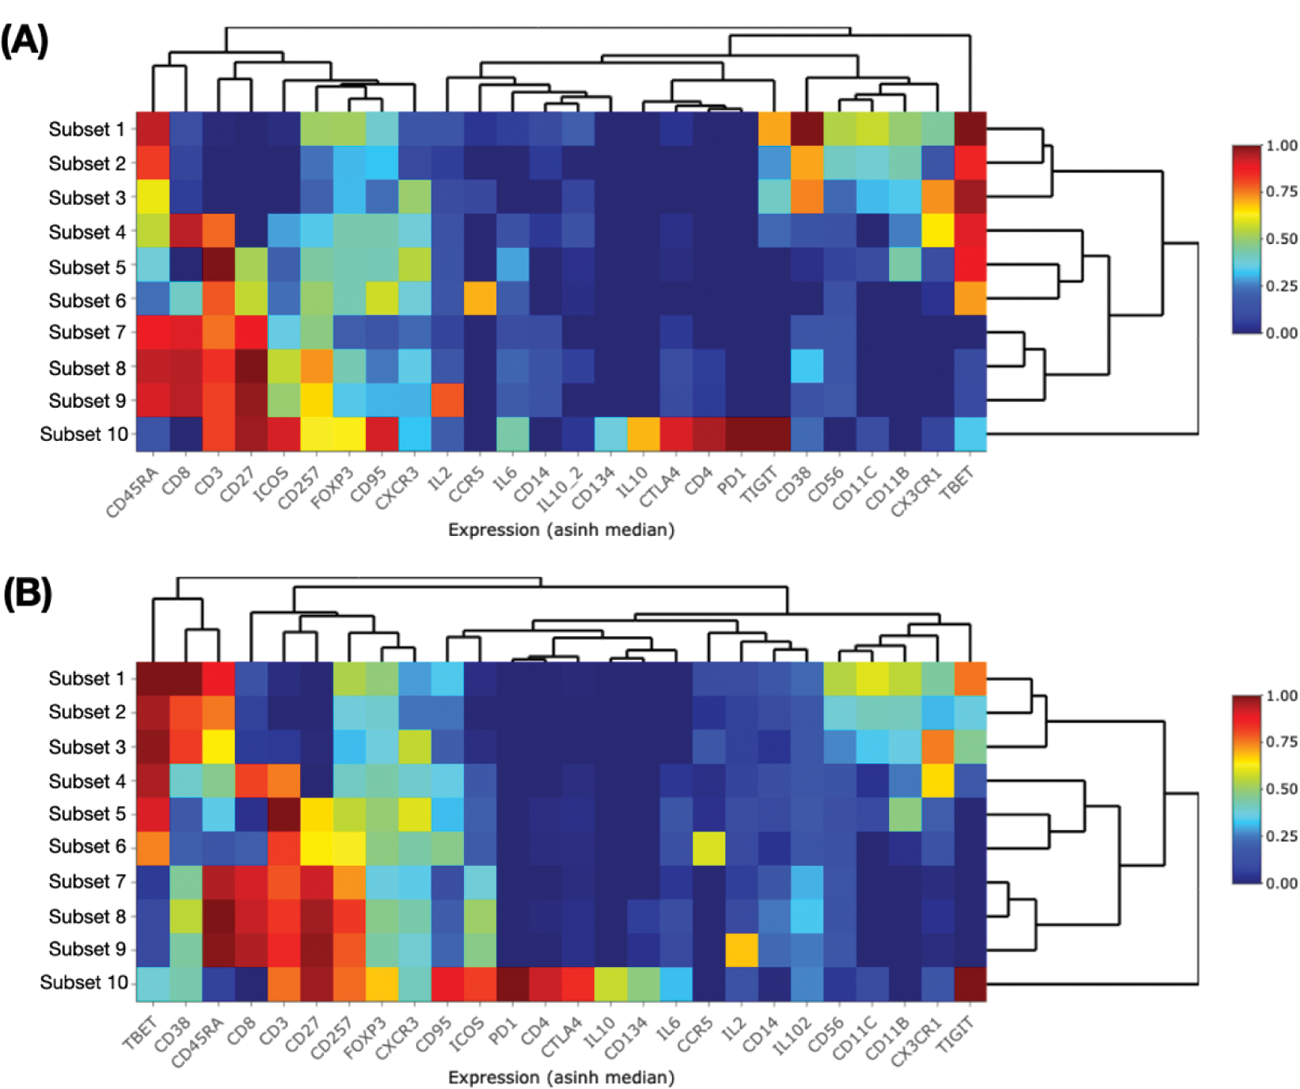
Subset heat maps from the discovery (A) and validation cohorts (B). Validation cohort cell clusters were derived via automation (mapped using discovery cohort data) and display similar phenotypes to the discovery cohort.
Acknowledgements: NIL.
Disclosure of Interests: None declared.