
Background: Psoriatic arthritis (PsA) is heterogeneous disease. Its various clinical features may be driven by different immune mechanisms, that may explain the differential response to therapies.
Objectives: We aimed to characterize the relationships between peripheral blood immune cell profiles in patients with PsA and (1) baseline clinical and imaging disease features; (2) response to targeted advanced therapies at 3 months.
Methods: Patients with PsA who were initiating treatment with advanced therapies for active peripheral musculoskeletal disease were recruited. Patients were examined and musculoskeletal ultrasound was performed to assess the level of inflammation in various PsA domains at baseline and after 3 months of treatment. Mass cytometry (CyTOF) was performed to characterize immune cell populations in whole blood. The frequencies of 16 immune cell populations (among CD3+ positive cells) were automatically quantified using Probability State Modelling algorithms. Hierarchical clustering was performed using immune cell population data. The association between the 3 identified immune cell clusters and baseline characteristics, as well as clinical and sonographic response to treatment, was assessed using series of GEE regression models adjusting for medication class. Change in immune cell clustering was assessed after 3 months.
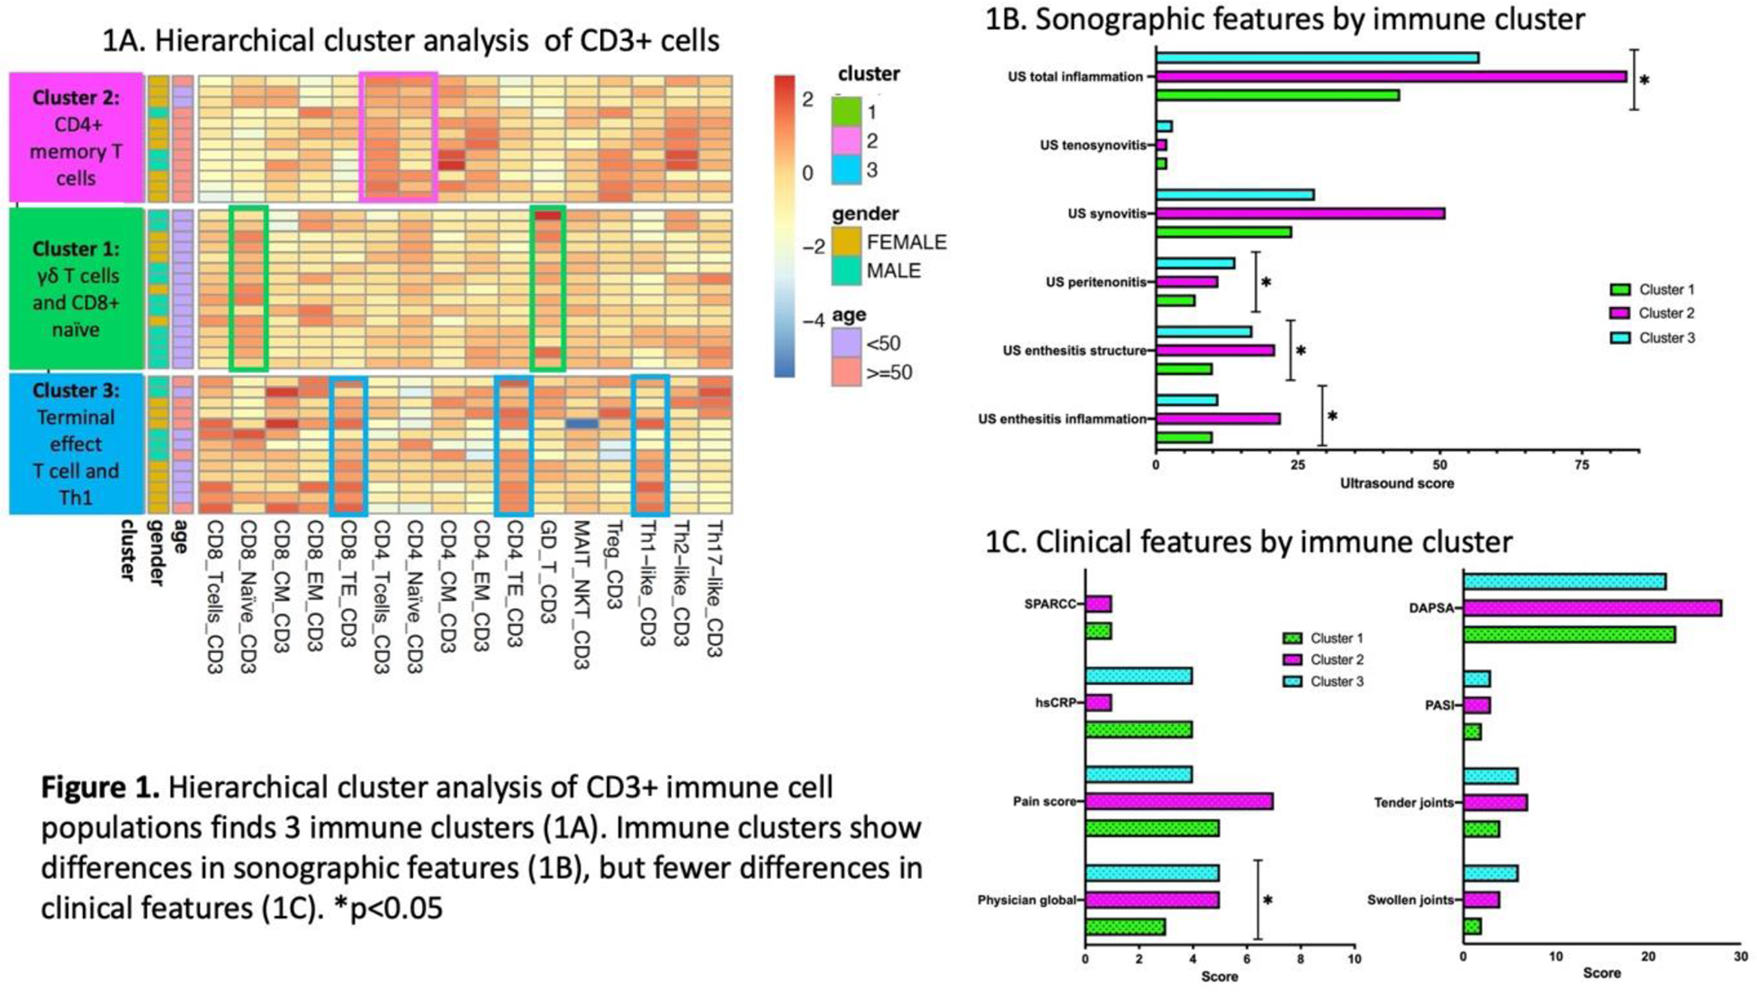
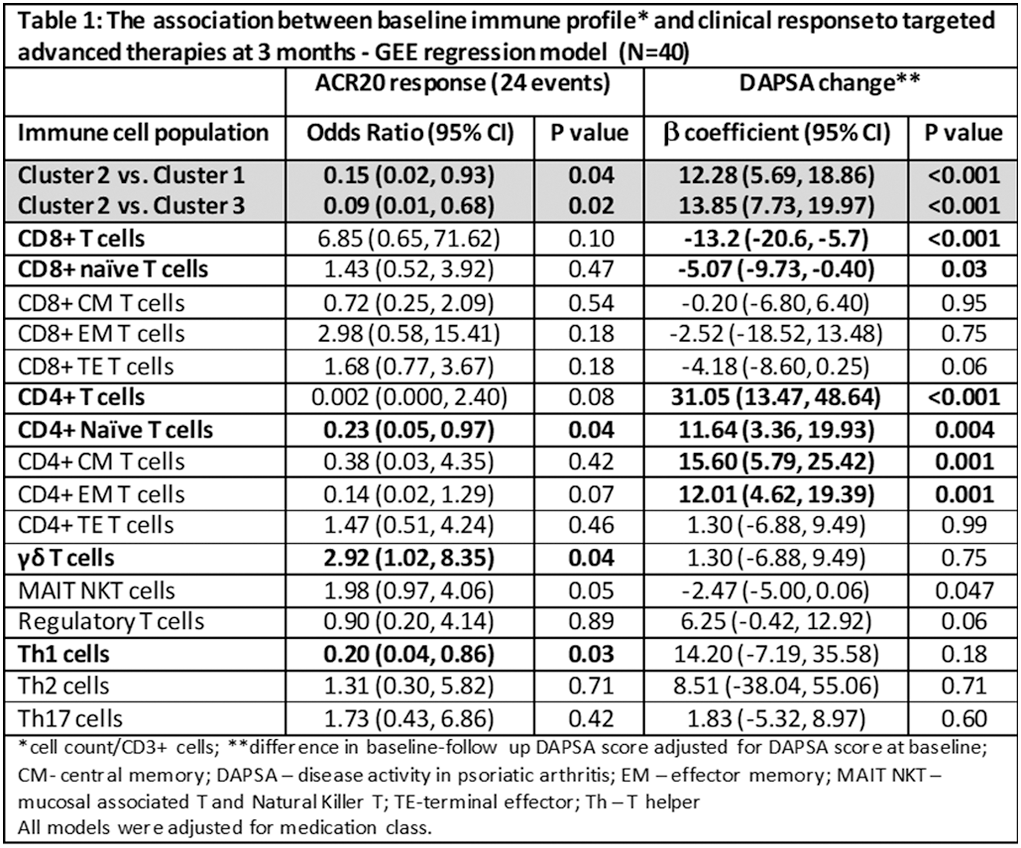
Results: 40 treatment periods involving 34 patients were analyzed (21 IL-17i; 16 TNFi; 3 JAKi). 60% of patients achieved ACR20 response. Cluster analysis identified 3 immune clusters (Figure 1). Cluster 1 (γδ T cells and CD8+ naïve predominant) was associated with lower sonographic inflammation, lower physician global assessment and younger age. Cluster 2 (Central Memory (CM) and Effector Memory (EM) CD4+ T cells predominant) was associated with the highest levels of sonographic inflammation, in particular synovitis and enthesitis scores, and older age. Cluster 3 (CD4+ and CD8+ Terminal Effector (TE) T cells and Th1 predominant) was associated with highest levels of peritenon inflammation ( Figure 1 ). Immune cell profiles were associated with clinical and sonographic response to therapy. Being in Cluster 2 was associated with a lower probability of achieving ACR20 response and with an increase in Disease Activity index for PsA (DAPSA) score compared to clusters 1 and 3 ( Table 1 ). Among individual cell populations, higher levels of CD8+ cells, in particular naïve cells, was associated with reduction in DAPSA. Higher levels of γδ T cells was associated with higher chances of achieving ACR20 response, while higher levels of naïve EM and CM CD4+ and Th1 cells were associated with lower treatment response (Table 1). The levels of Th1 (adjusted β 9.5 (95% CI 1.75, 17.33)) and γδ T cells (adjusted β -6.72 (95% CI -12.47, -0.98)) also predicted change in sonographic inflammatory score. Following therapy, immune clusters remained overall stable (one patient was re-classified from cluster 3 to cluster 1).
Conclusion: Immune cell profiling can improve PsA phenotyping. CD4+ memory and Th1cells correlated with more severe synovitis and enthesitis and poor response to advanced therapies, while γδ T cells and CD8+ naïve cells were associated with milder disease phenotype and improved treatment response.


REFERENCES: NIL.
Acknowledgements: NIL.
Disclosure of Interests: Lihi Eder BMS, Janssen, Eli Lilly, Abbvie, Pfizer, Novartis. UCB, BMS, Janssen, Eli Lilly, Abbvie, Pfizer, Novartis. UCB, Fresenius Kabi, Sandoz,, Xianwei Li: None declared, Sydney Thib: None declared, Darshini Ganatra: None declared, Liqun Diao: None declared, Vinod Chandran Partner employee AstraZeneca, AbbVie, Amgen, Bristol-Myers Squibb (BMS), Eli Lilly, Janssen, Novartis, UCB, AbbVie, Amgen, Bristol-Myers Squibb (BMS), Eli Lilly, Janssen, Novartis, UCB