
Background: Despite progresses, the molecular mechanisms underlying Kawasaki Disease (KD) and intravenous immunoglobulin’s (IVIG) ability to mitigate the inflammatory process remain incompletely understood.
Objectives: To comprehensively characterize the acute immune profile of KD and evaluate how IVIG influence it.
Methods: In this prospective study, plasma proteomic profile, T cells phenotype, and gene-expression of sorted T cell subsets along with full clinical characteristics, were investigated in KD patients and compared with age-sex-matched healthy and febrile controls (FC). Blood samples from KD patients were collected at three timepoints: at diagnosis (T0), 48 hours (T1), and 4 weeks after IVIG therapy (T2). Plasma samples were analyzed for proteomics using Olink technology. PBMCs were isolated and analyzed by flow cytometry. After sorting, RNA of Tregs, CD4+ Central memory (CM) and CD4+ Effector memory (EM) T cells was amplified and loaded on a Fluidigm 96.96 standard chip to assess gene expression.
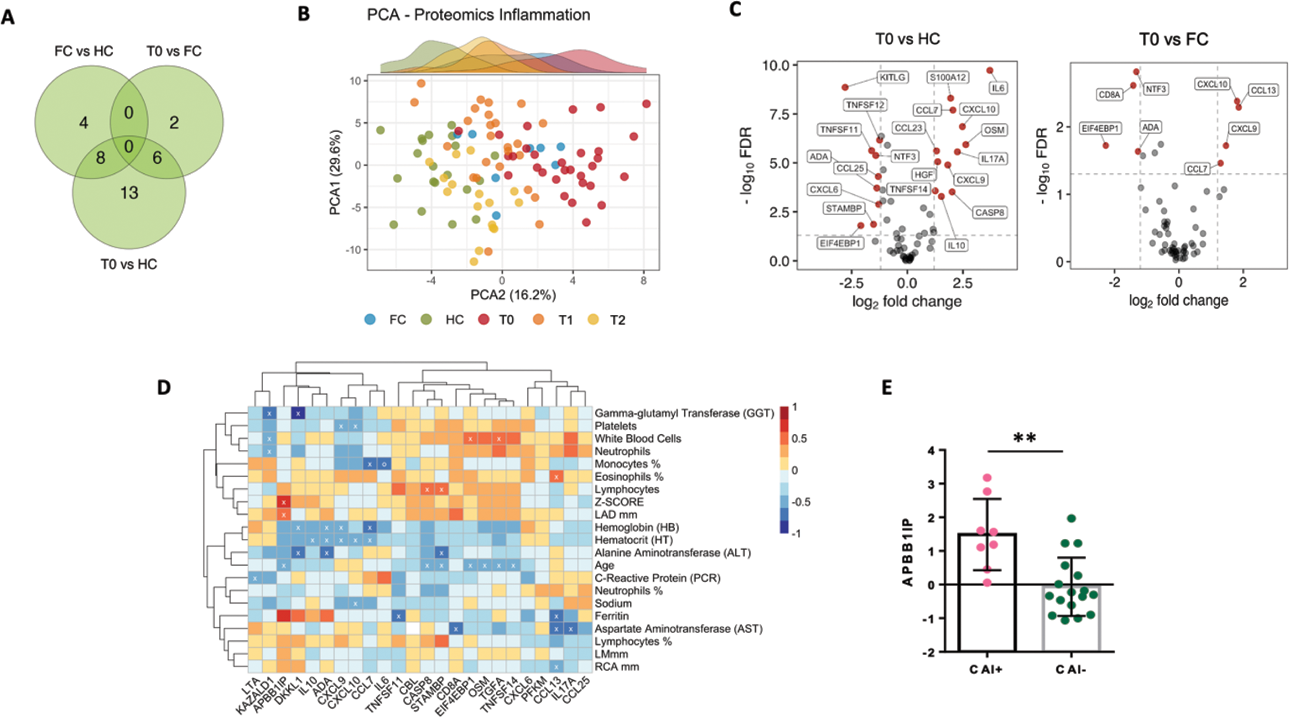
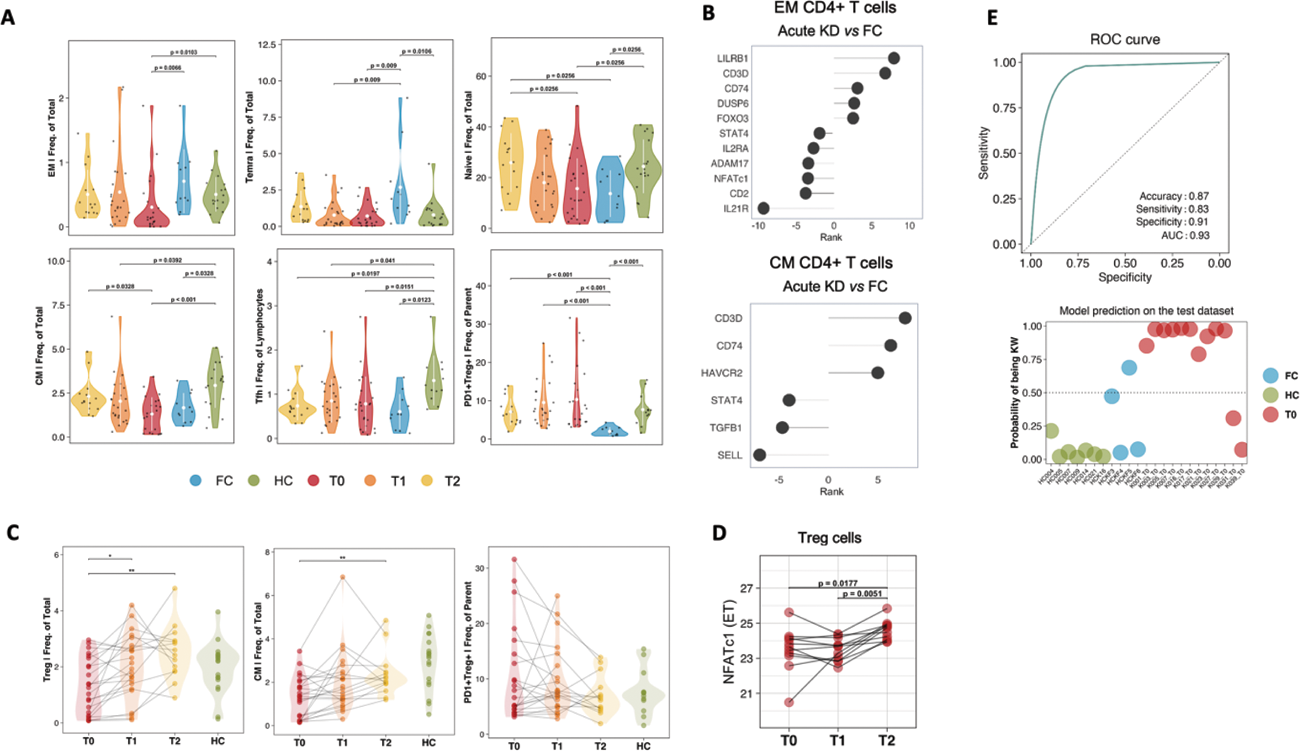
Results: This study included 43 KD children [median age 1.9 (range, 0.37-7.15) years, 24 male (55%)] and both 31 healthy children [median age 2.05 (range, 0.19-5.38) years; 15 male (48.4%)] and 11 febrile patients [median age 2.82 (range, 1.1-6.0) years, 6 male (54.5%)] as control groups. Proteomic analysis of 184 proteins from 43 KD children in the acute phase revealed distinctive inflammatory features respect controls (Figure 1 A) which are differently modulated by IVIG treatment as highlighted by principal component analysis, (Figure 1B). This signature involved mainly inflammatory Th-1 and Th-17 mediators and immune cell regulation proteins (Figure 1C). This approach unveiled a potential disease severity signature, as APBB1IP levels demonstrated a positive association with echocardiogram values [left anterior descending (LAD) Z-SCORE, p=0.001, r=0.66; Figure 1D]. Furthermore, this protein was found to be elevated in coronary artery involvement (CAI+) compared to CAI- patients (p=0.0018, Figure 1E). Phenotype analysis of T cell compartment revealed a transient reduction in CD4+ EM T cells and CD4+ TEMRA T cells and a comprehensive immune activation and exhaustion with an increase of PD1+Treg cells respect controls (Figure 2A). To further characterize KD immunological profile, we investigated gene expression in sorted CD4+ EM, CD4+ CM and Treg cells. Differential analysis between KD and FC, revealed 17 differentially expressed genes, 11/17 within the EM subset and 6/17 within the CM T cells subset (Figure 2B) suggesting that qualitative perturbation, identified by transcriptional analysis, coupled with quantitative T cell subsets analysis may define distinctive signatures of KD as compared to FC. Following IVIG, both quantitative (Figure 2C), and gene expression analyses (Figure 2D) revealed Tregs immune dynamics of recovery. Leveraging machine learning methods, we identified pivotal contributors distinguishing KD from control groups with an accuracy of 0.87 (Figure 2E).
Conclusion: Our data provide insights into KD pathogenesis which may offer valuable information on prognostic indicators.
A) Venn diagram highlights the number of differentially expressed proteins (DEPs) found across KD patients and the controls. B) PCA of inflammatory proteins allows to distinguish acute KD from the controls. C) Volcano plot showing DEPs between groups. D) Heat map illustrating correlations between proteins, laboratory parameters, and echocardiogram values in KD children. E) Levels of APBB1IP in KD children who developed CAI compared to those who did not develop CAI. ** p<0.01

A) Violin plots illustrating differences in cell T subsets in KD and controls. B) DEPs ranked by p-value and fold change in sorted EM CD4+ T cells and CM CD4+ T cells between acute KD and FC. C) Longitudinal flow cytometry analyses reveal an increase of Treg and CM CD4+ T cell subsets after IVIG therapy. D) Longitudinal alterations in gene expression post IVIG therapy within Treg subset. E) The performance metrics of our mathematical model

REFERENCES: NIL.
Acknowledgements: We would like to acknowledge all patients and guardians who decided to participate in the study. We acknowledge Jennifer Faudella, Ilaria Pepponi, Melania Fantini for administrative assistance and Tamara Di Marco and Nadia Iavarone as professional study nurses.
Disclosure of Interests: None declared.