fetching data ... 
Background: Existing linear polygenic risk score (PRS) models for autoimmune diseases have limitations in accurately accounting for non-additive risk effects and interactions between HLA haplotypes [1-2], which are key aspects in the genetic composition of these diseases. Graph Convolutional Networks (GCNs), with their capacity to integrate both the genotypes of risk variants and the genotypic relationships among samples [3], present a potential approach to overcome these limitations. However, there’s a lack of extensive research validating the diagnostic capabilities of GCN-based PRS.
Objectives: To develop and validate a GCN-based PRS model (GRAF-AID, Graph-based Risk Assessment For Auto Immune Disease) specialized for autoimmune diseases.
Methods: Using the genotypic data of four autoimmune diseases (rheumatoid arthritis (RA), multiple sclerosis (MS), psoriasis (PSO), celiac disease (CEL)) and two non-autoimmune diseases (Atrial Fibrillation, Alzheimer’s disease) from the UK Biobank. We constructed models on a cohort of 20,000 British Whites using 5-fold cross-validation and tested their performance on 10,000 non-British Whites. For RA, we also used the BioBank Japan and IORRA data. The performance of GRAF-AID were compared to those constructed by PRSice-2, PRScs, and a Simple Neural Net (SNN) using AUC and Nagelkerke’s R2. Additionally, the Layer-wise Relevance Propagation (LRP) technique was employed to visualize how individual SNPs contribute to the models’ predictive accuracy.
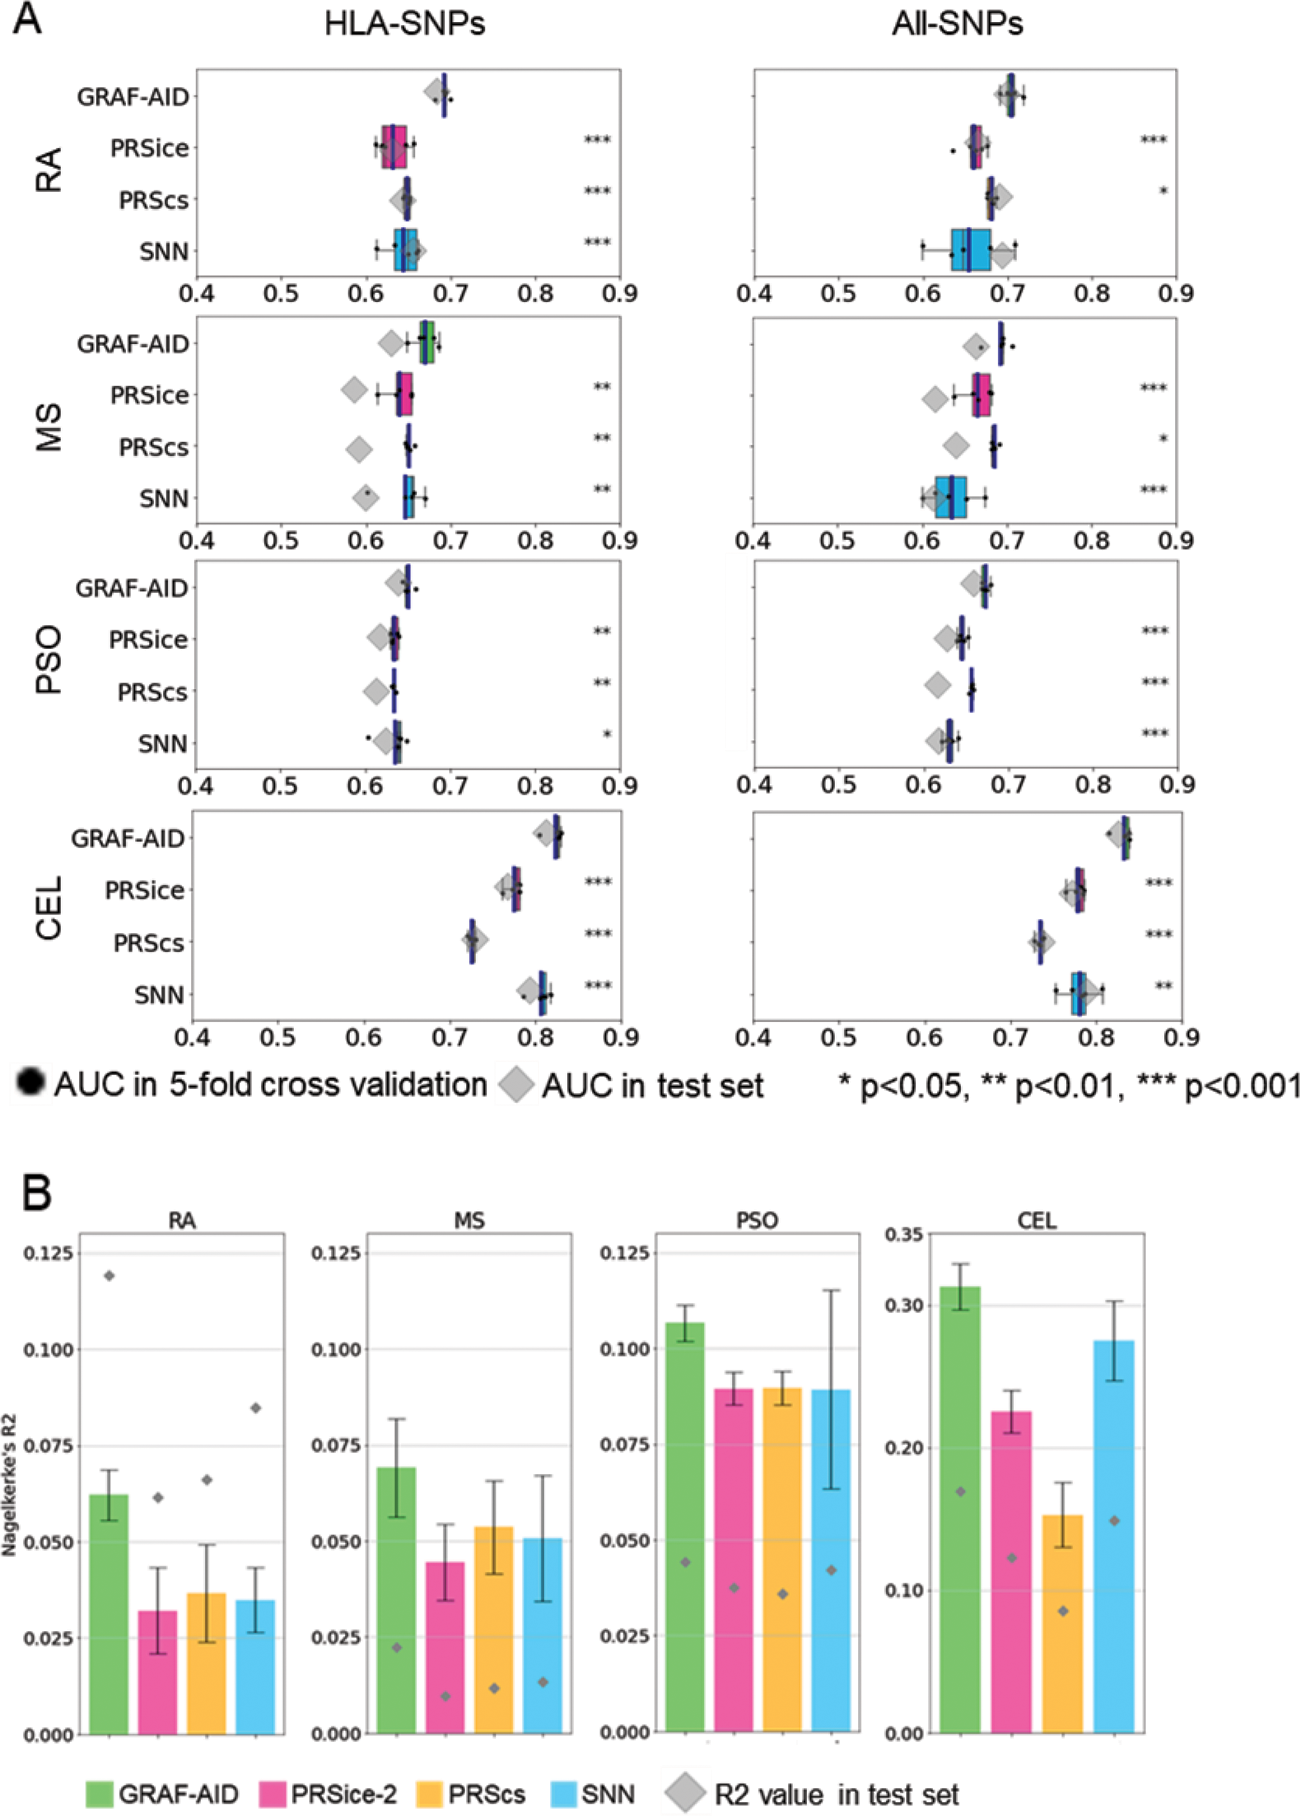
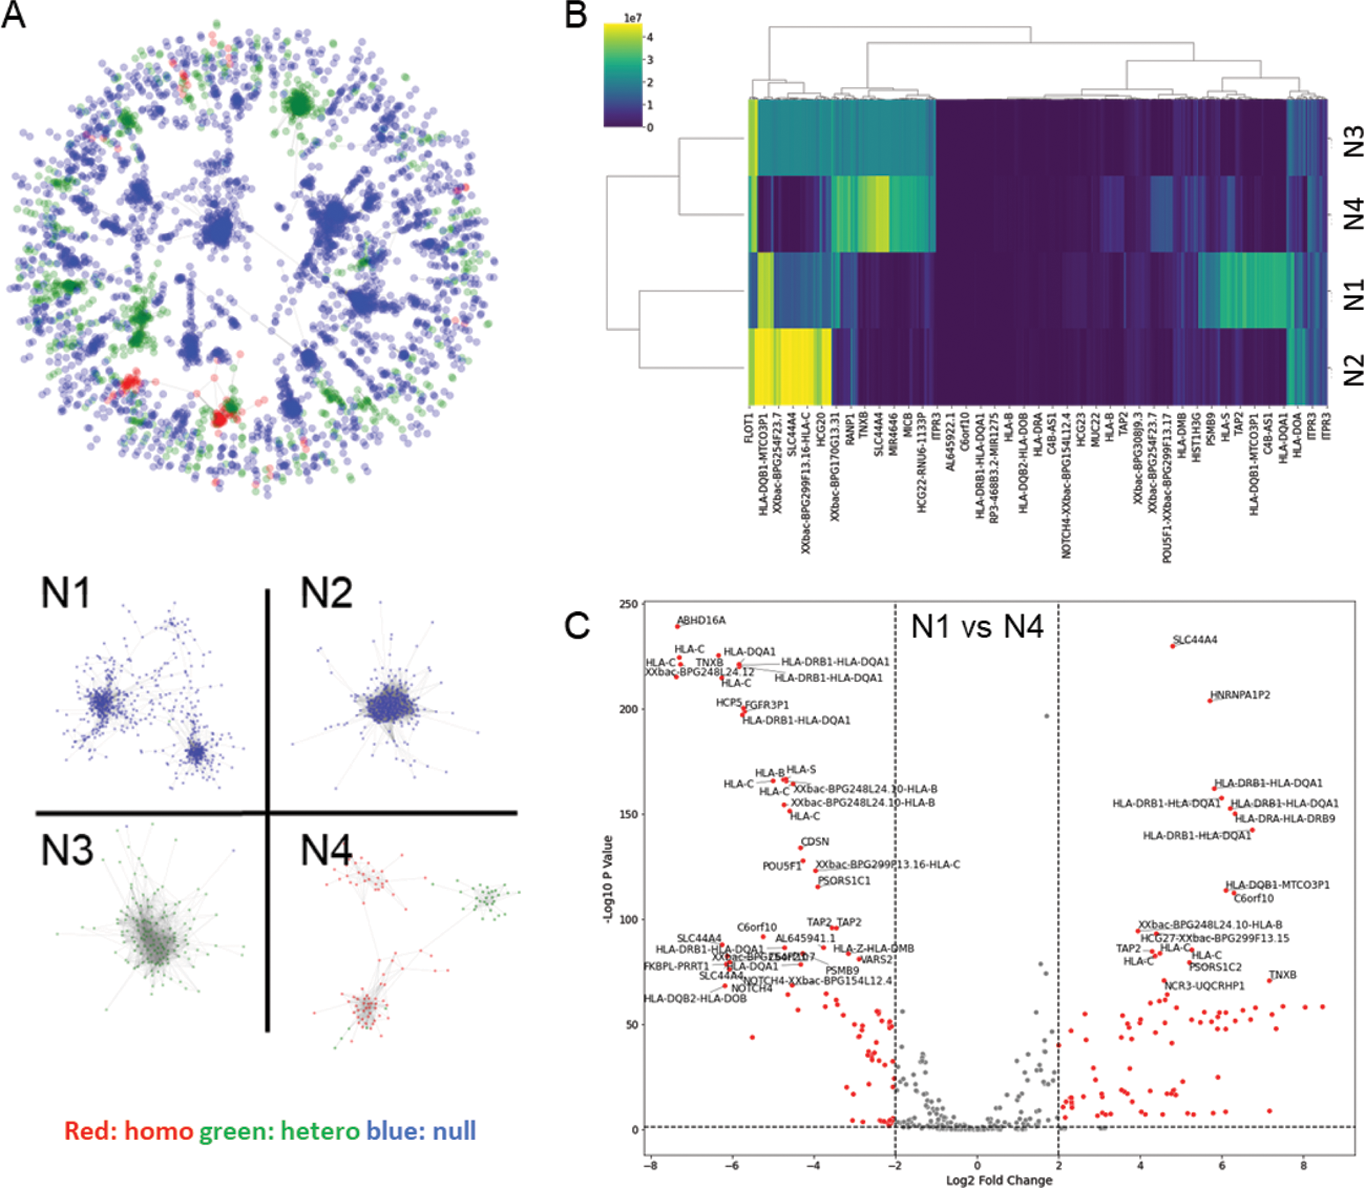
Results: When constructed using SNPs from the HLA region, GRAF-AID consistently outperformed the conventional PRS models including PRSice-2, PRScs, and SNN models in all comparisons for each of the four autoimmune diseases with p-values <0.05 (Figure 1A left). However, GRAF-AID was comparable to other methods for the non-autoimmune diseases. When utilizing SNPs from all genomic regions, the GRAF-AID was superior to other models for the four autoimmune diseases, with the sole exception of the SNN model for RA (Figure 1A right). Additionally, GRAF-AID demonstrated 20-50% higher Nagelkerke’s R2 values compared to other methods for all four autoimmune diseases (Figure 1B). GCN visualization for RA (Figure 2A upper) revealed networks formed based on the count of HLA risk allele DRB1*04:01, a pattern also observed for MS (DRB1*15:01), PSO (B*57:01), and CEL (DQB1*02:01). We extracted the four major connected networks (N1-N4) from the complete set of networks based on sample size (Figure 2A lower). It was observed that networks associated with risk alleles (N3, N4) exhibited a high true positive rate, while networks related to null alleles (N1, N2) showed a high true negative rate. Further, LRP analysis highlighted the variable SNP contributions to disease risk prediction across different connected networks (Figure 2B), and identified SNPs with significant variation in LRP scores between connected networks (Figure 2C), indicating the differential impact of specific loci on disease risk across connected networks.
Conclusion: Our study developed a GCN-based PRS model with higher accuracy than existing PRS models, especially in the complex HLA region. This advance suggests a contribution to the field of precision medicine for autoimmune diseases.
REFERENCES: [1] Lenz TL, et al. Nat Genet 2015; 47: 1085–90.
[2] Lincoln MR, et al. Proc Natl Acad Sci U S A 2009; 106: 7542–7.
[3] Wang T, et al. Nat Commun 2021; 12: 3445.
Performance evaluation of four prediction models across four autoimmune diseases. (A) Comparison of AUC between GRAF-AID and other existing PRS models for four autoimmune diseases. (B) Comparison of Nagelkerke’s R 2 between GRAF-AID and other existing PRS models in HLA-SNPs.
The roles of HLA alleles in GRAF-AID in RA. (A) Distribution of HLA alleles in GRAF-AID networks of RA. (B) Hierarchical clustering based on the LRP score of each SNP across connected networks. (C) Visualization of LRP score variation of SNP across connected networks with a volcano plot.
Acknowledgements: NIL.
Disclosure of Interests: Suguru Honda: None declared, Katsunori Ikari Ayumi Pharmaceutical Corp., Chugai Pharmaceutical Co., Ltd., Mitsubishi Tanabe Pharma Co., Mochida Pharmaceutical Co., Ltd., Nippon Kayaku Co., Ltd., Teijin Pharma Ltd., Chikashi Terao: None declared, Masayoshi Harigai AbbVie Japan GK., Ayumi Pharmaceutical Co., Boehringer Ingelheim Japan, Inc., Bristol Myers Squibb Co., Ltd., Chugai Pharmaceutical Co., Ltd.,Eisai Co., Ltd. Eli Lilly Japan K.K., GlaxoSmithKline K.K., Kissei Pharmaceutical Co., Ltd., Pfizer Japan Inc.,Takeda Pharmaceutical Co., Ltd., Teijin Pharma Ltd., AbbVie, Boehringer-Ingelheim., Bristol Myers Squibb Co., Kissei Pharmaceutical Co., Ltd., Teijin Pharma., AbbVie Japan GK., Asahi Kasei Corp., Astellas Pharma Inc., Ayumi Pharmaceutical Co., Bristol Myers Squibb Co., Chugai Pharmaceutical Co., Ltd., Daiichi-Sankyo, Inc., Eisai Co., Ltd., Kissei Pharmaceutical Co., Ltd., Mitsubishi Tanabe Pharma Co., Nippon Kayaku Co., Ltd., Sekisui Medical, Shionogi & Co., Ltd., Taisho Pharmaceutical Co., Ltd., Takeda Pharmaceutical Co., Ltd., Teijin Pharma Ltd., Yuta Kochi: None declared.