fetching data ... 
Background: Pain is the primary symptom of patients with osteoarthritis (OA) and remains poorly understood from an immunological perspective.
Objectives: To delineate a comprehensive systemic immunological signature of OA-related pain with a particular emphasis on the role of regulatory T cells (Treg)
Methods: We enrolled 46 patients with knee OA as part of the TRANSIMMUNOM clinical trial (NCT02466217). Inclusion criteria were radiographic knee OA with a Kellgren-Lawrence score of 2 or 3. Exclusion criteria included individuals with previous total knee arthroplasty, inflammatory rheumatic diseases or secondary OA. For each patient, we collected clinical data, including WOMAC pain (0-100) and DN4 scores (0-10). Blood deep immunophenotyping was performed using 13 different flow cytometry panels, generating 800 parameters (Duraclone technology, Beckman Coulter). 62 serum cytokines were quantified using the Luminex Multiplex Assay xMAP® Technology. For RNA sequencing, peripheral blood CD4+CD25+CD127- Treg cells were sorted with a purity > 80%. RNA sequencing was performed on mRNA libraries prepared with SMART-Seq® v4 Ultra® Low Input RNA Kit on high quality RNA. Differential gene expression analysis using DESEq2 and functional analysis using GO and STRING databases were applied. Significance was tested by statistical analyses, including Spearman correlation and Mann-Whitney analysis.
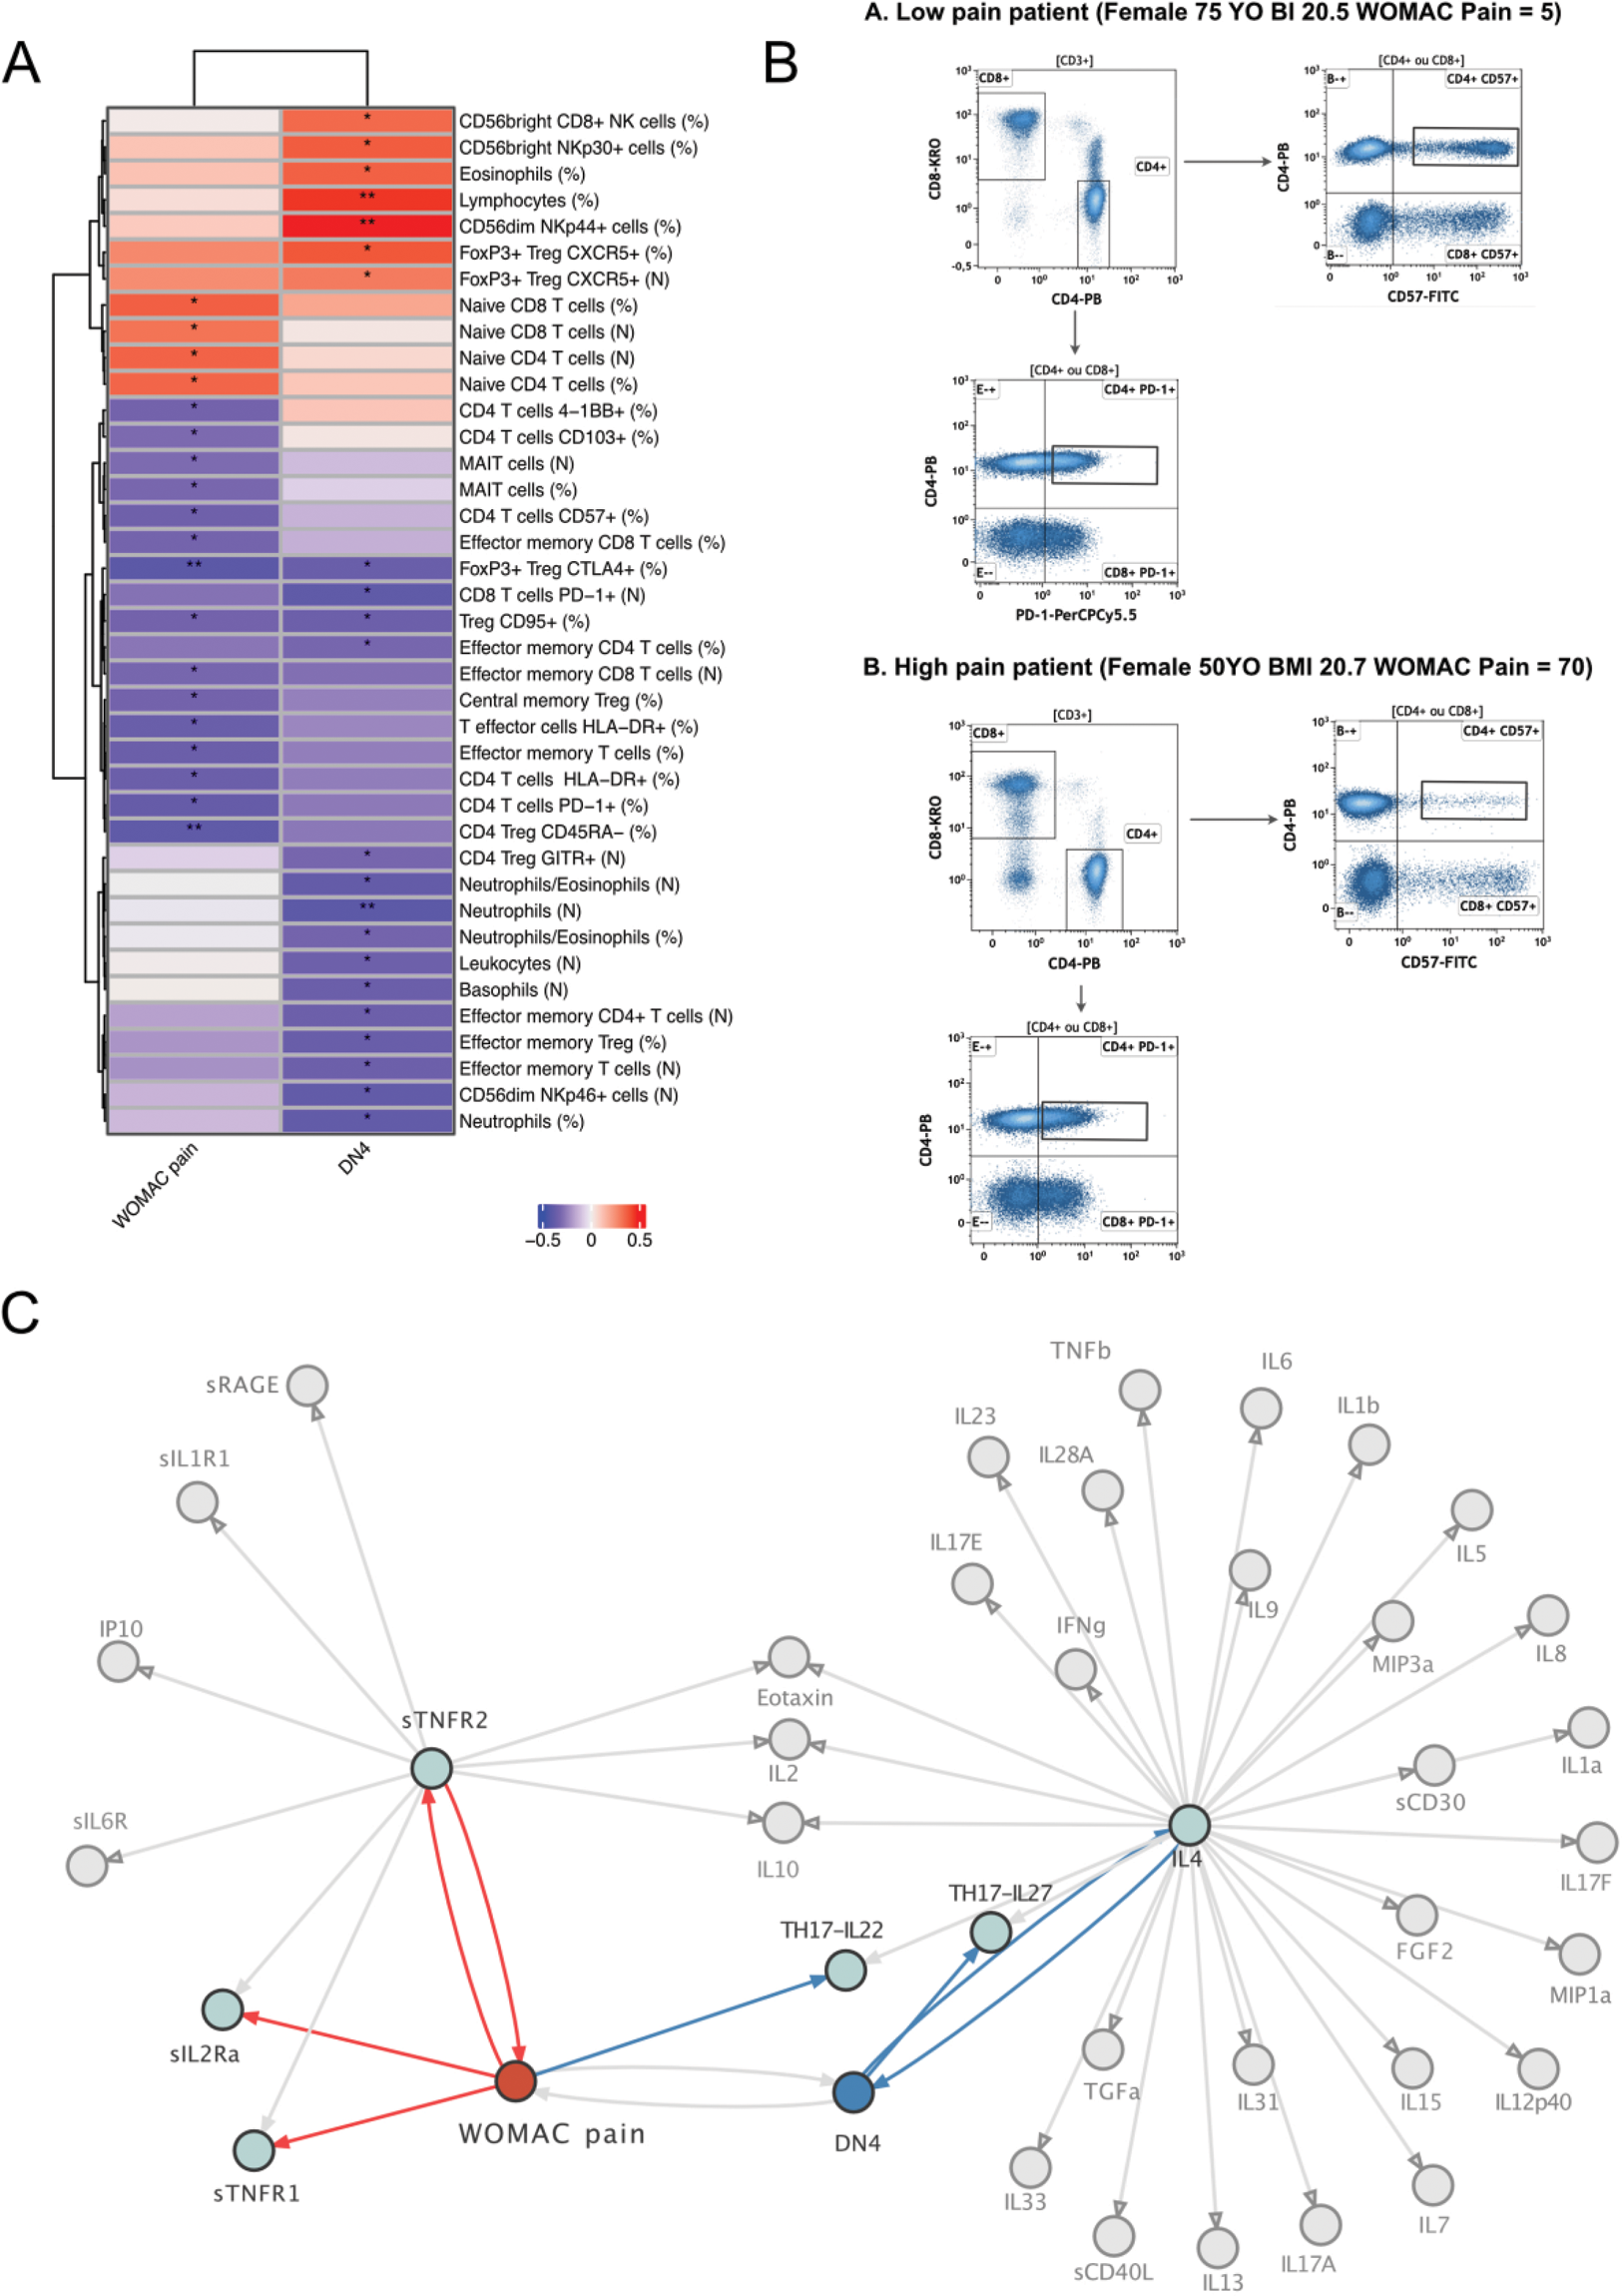
Results: The cohort consisted of 65.2% women (N=30) and 34.8% men (N=16), the mean age was 64.8 years old (standard deviation (SD=9.9) and the mean BMI was 29.1 (SD=7.1). The mean WOMAC pain score was 44.2 (SD=12.7), and the mean DN4 was 2.17 (SD=1.8). There was no significant difference between patients with low and high pain intensity (WOMAC pain < or ≥40/100) in terms of age, BMI, gender, and KL score. Deep immunophenotyping identified 19 and 22 cell populations that correlated with WOMAC pain and DN4 respectively (p<0.05|r|≥0.2) (Figure 1). Among these, four populations related to Treg activation and functionality (FoxP3+CTLA4+, CD4+CD57+, Treg CD95+ and CD4 Treg CD45RA+) were negatively correlated with the WOMAC pain score. Cytokine analysis revealed that soluble factors associated with Treg expansion and activation (sIL2-RA, sTNFR1, sTNFR2, IL-22) were also associated with the WOMAC pain score. In addition, DN4 was negatively correlated with IL4 and IL27. Differential gene expression analysis of Tregs between patients with low and high WOMAC pain scores identified 320 upregulated genes including IL-1RL1, IL31RA, VEGFA, MMP11, TNFRSF14 and 123 downregulated genes ( Figure 2 |log2(FC)|≥log2(2),p<0.01). We found that patients with high WOMAC pain scores showed an upregulation of pathways implicating pathways related to immune regulation, molecular mediators, and cytokine regulation (p<0.01) based on GO over-representation analysis. In addition, using STRING we identified 23 functional modules associated with up-regulated genes in high pain patients including pro-inflammatory modules such as IFN, IL1R1, NLRP3 modules.
Conclusion: This study reports an extensive blood immune profiling of knee OA pain, emphasizing systemic dysregulation of Tregs. These findings underscore the involvement of the adaptive immune system in OA pain, extending beyond conventional low-grade inflammation paradigms and offering novel pathophysiological insights.
REFERENCES: NIL.
Deep Immunophenotyping, proteomic and Treg transcriptomic profiling of OA pain. A. Spearman correlations between cell populations and WOMAC pain or DN4 (p<0.05, |r|≥0.2). B. CD4+CD57+ cell proportions from two representative patients with low (top) and high (bottom) pain intensity, matched on age, gender, and BMI. C Differentially expressed Tregs genes linked to OA pain, up-regulated (right) and downregulated (left) genes in patients with high pain as compared with patients with low pain are shown. Significant genes are labelled in red (|log2FC|≥log(2), p<0.01). D Cytokines correlation with WOMAC pain and DN4 scores. Positive and negative correlations are highlighted in red and blue. cytokines-cytokines correlations are in grey (p<0.05,|r|≥0.2).
Acknowledgements: NIL.
Disclosure of Interests: None declared.