
Background: Several metabolic pathways have been implicated in rheumatoid arthritis fibroblast-like synoviocytes (RA FLS) aggressive phenotype [1,2].
Objectives: Here, we aimed to analyse the full spectrum of metabolic alterations associated with RA by performing untargeted metabolomics using mass spectrometry in RA FLS vs. non-inflamed (NI) FLS.
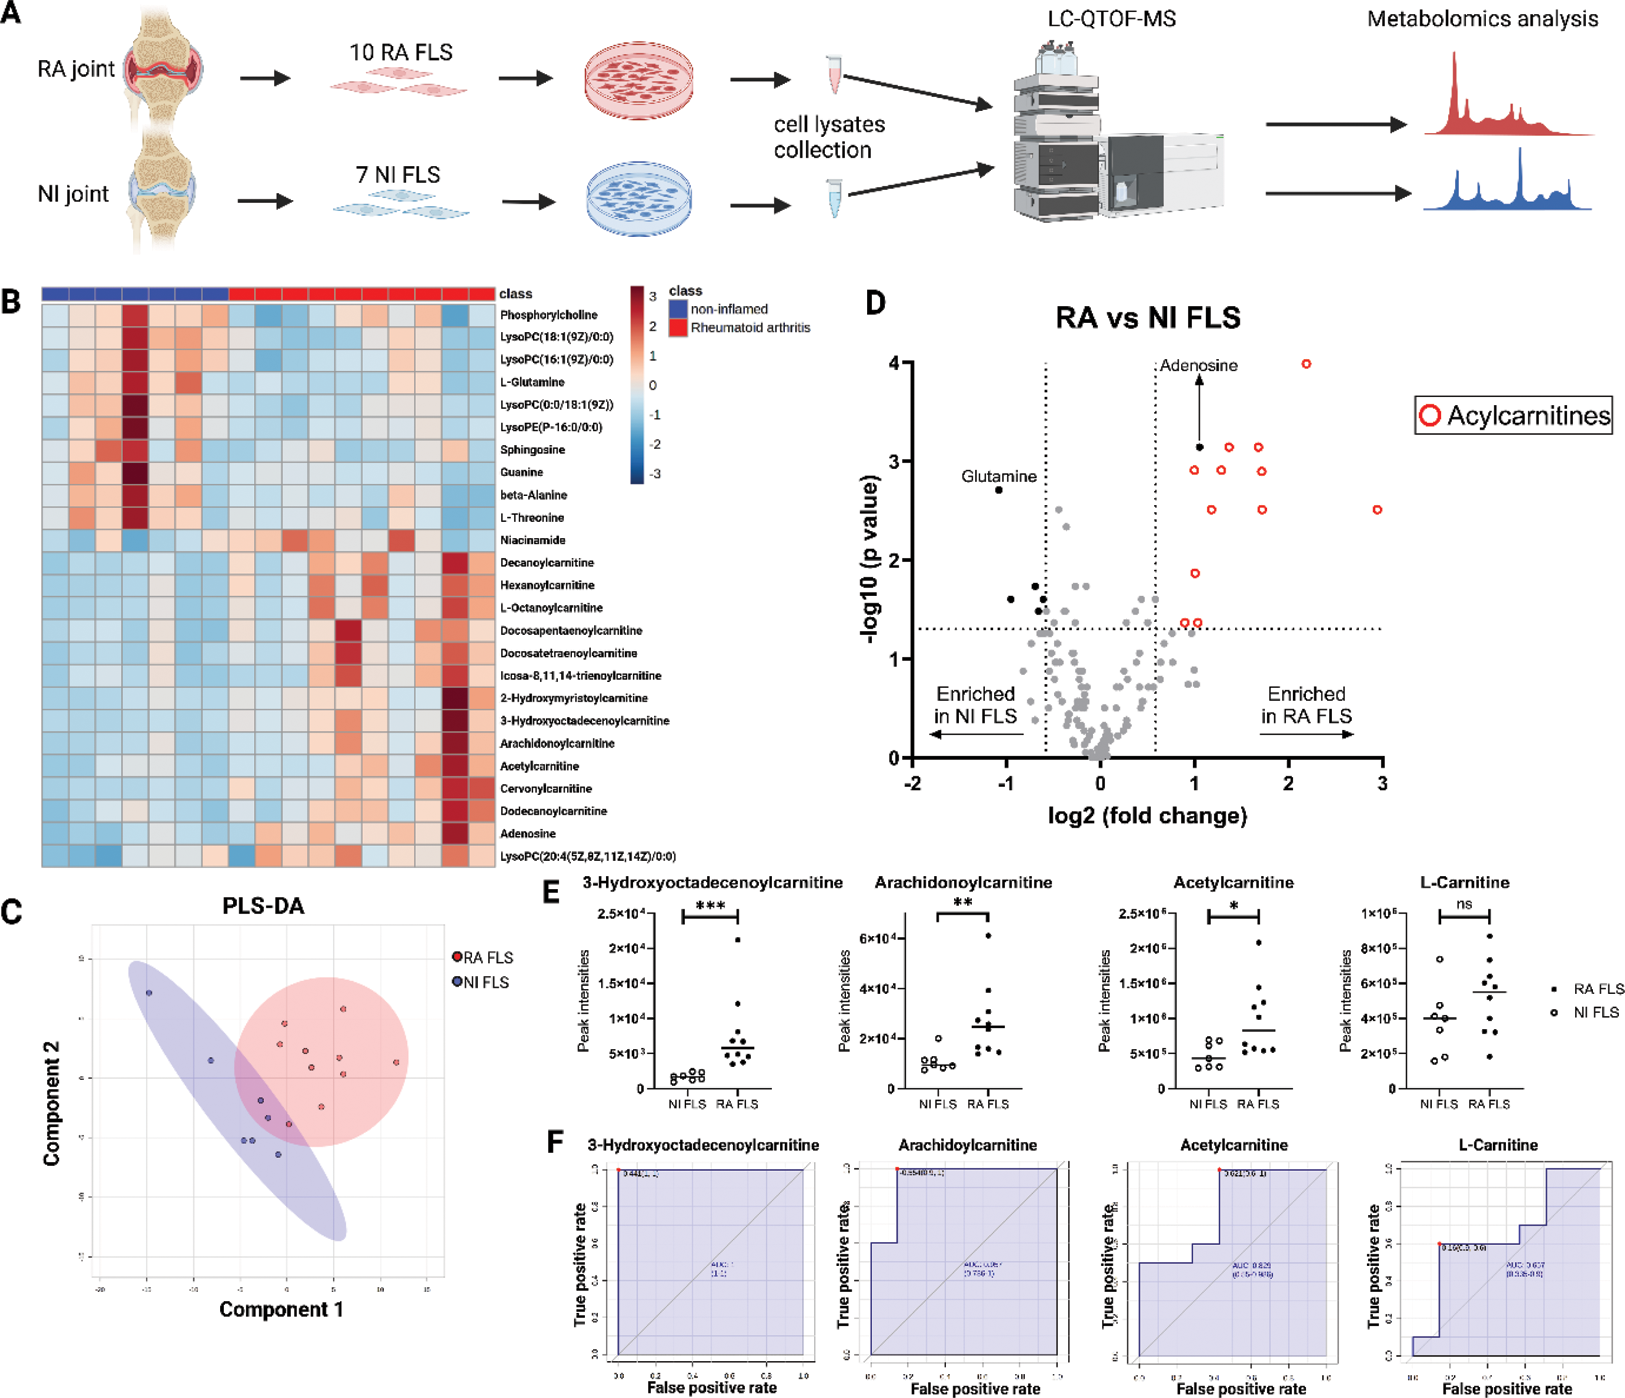
Methods: Ten RA FLS were obtained from synovial tissue specimens from patients with RA undergoing joint replacement surgery. Seven NI FLS were obtained from patients with no previous history of arthritis, undergoing diagnostic arthroscopy due to previous injury that occurred over 2 months prior to the operation. We collected primary RA and NI FLS culture extracts and untargeted annotated metabolomics were performed using liquid chromatography coupled to quadrupole time-of-flight mass spectrometry (Figure 1A).
Results: Peak intensities of 138 annotated metabolites were acquired. Metabolomics analysis revealed a distinct metabolic fingerprint between RA and NI FLS as illustrated by hierarchical clustering shown as heatmap, and partial least squares - discriminant analysis (Figure 1B and C). A volcano plot combining fold change analysis and Mann-Whitney test revealed 18 metabolites having different levels in RA and NI FLS; 13 were enriched in RA FLS, while five were enriched in NI FLS (Figure 1D). Of the 13 metabolites enriched in RA FLS, 12 were acylcarnitines (Figure 1E and F).
Conclusion: RA FLS show an accumulation of acylcarnitines compared to NI FLS, which suggests an involvement of lipid metabolism in RA pathophysiology. Further studies are needed to understand this phenomenon and to determine if acylcarnitine accumulation in FLS contributes to FLS dysfunction in RA.
FLS metabolomics analysis. A. Experimental set up overview. B. Clustering result shown as heatmap. Distance measure using Euclidean distance, and clustering algorithm using Ward’s linkage. Samples are shown on the x axis, while metabolites are shown on the y axis. C. Partial least squares - discriminant analysis showing the 2-D scores plot between principal component 1 and 2. Each dot represents a sample. The cycles show the 95% confidence interval. D. Enriched metabolites by volcano plot defined as fold change (x) ≥1.5 and Mann-Whitney test p-value (y) <0.05. The red dots represent acylcarnitines. E. Dot plots of the peak intensities of three selected acylcarnitines and L-carnitine in NI RA FLS. Mann-Whitney test was performed. p<0.05 was signified with *, p<0.01 with **, and p<0.001 with ***. F. ROC curves of three selected acylcarnitines and L-carnitine. Sensitivity is on the y-axis, and the specificity on the x-axis. Abbreviations: RA, rheumatoid arthritis; NI, non-inflamed; FLS, fibroblast-like synoviocytes; LC-QTOF-MS, liquid chromatography coupled to quadrupole time-of-flight mass spectrometry; PLS-DA, partial least squares - discriminant analysis; AUC, area-under-the-curve.

REFERENCES: [1] Falconer et al., Arthritis Rheumatol. 2018
[2] Sanchez-Lopez et al., J. Clin. Med. 2019.
Acknowledgements: NIL.
Disclosure of Interests: None declared.