fetching data ... 
Background: Using their autoantibody profile, patients with Systemic Lupus Erythematosus (SLE) can be grouped into four less heterogeneous subgroups [1]. Subgroup 1 is dominated by anti-SSA/SSB, Subgroup 2 by anti-nucleosome/Sm/RNP/dsDNA, Subgroup 3 by antiphospholipid antibody (aPL), and Subgroup 4 is negative for 13 antibodies tested, but ANA ever positive. Those subgroups differ in cytokine levels, clinical manifestations, and HLA-DRB1 gene associations [1].
Objectives: We hypothesize that the pathogenic mechanisms are different among these. We aim to evaluate whether there are differences in known SLE genetic risk factors and plasma protein levels among antibody-defined SLE subgroups.
Methods: We analyzed 448 patients from our previous study [1] to address differences in genetic risk factors. We used SLE Polygenic Risk Scores (PRS) previously described [2], comprising 4 HLA SNPs and 57 non-HLA SNPs to identify genetic variants that confer a higher PRS for each subgroup. We used a greedy search algorithm and defined the objective function (score) as the subgroup’s PRS minus the sum of the PRS for all other subgroups. In each iteration, a genetic variant was added to the optimal set if it improved the score by more than 1e-04. Subsequently, for each set of variants Gene Set Enrichment Analysis (GSEA) was performed against the Molecular Signatures Database (MSigDB). In addition to this, untargeted liquid chromatography-mass spectrometry (LC-MS) was implemented using plasma samples from 100 SLE patients, 25 representing each subgroup. Differential expression analysis was performed using linear modelling with the limma package. Pairwise comparisons were conducted among the subgroups. P-values for both approaches were corrected using False Discovery Rate (FDR) multiple-testing correction. Adjusted values (P-adj) lower than 0.05 were considered significant.
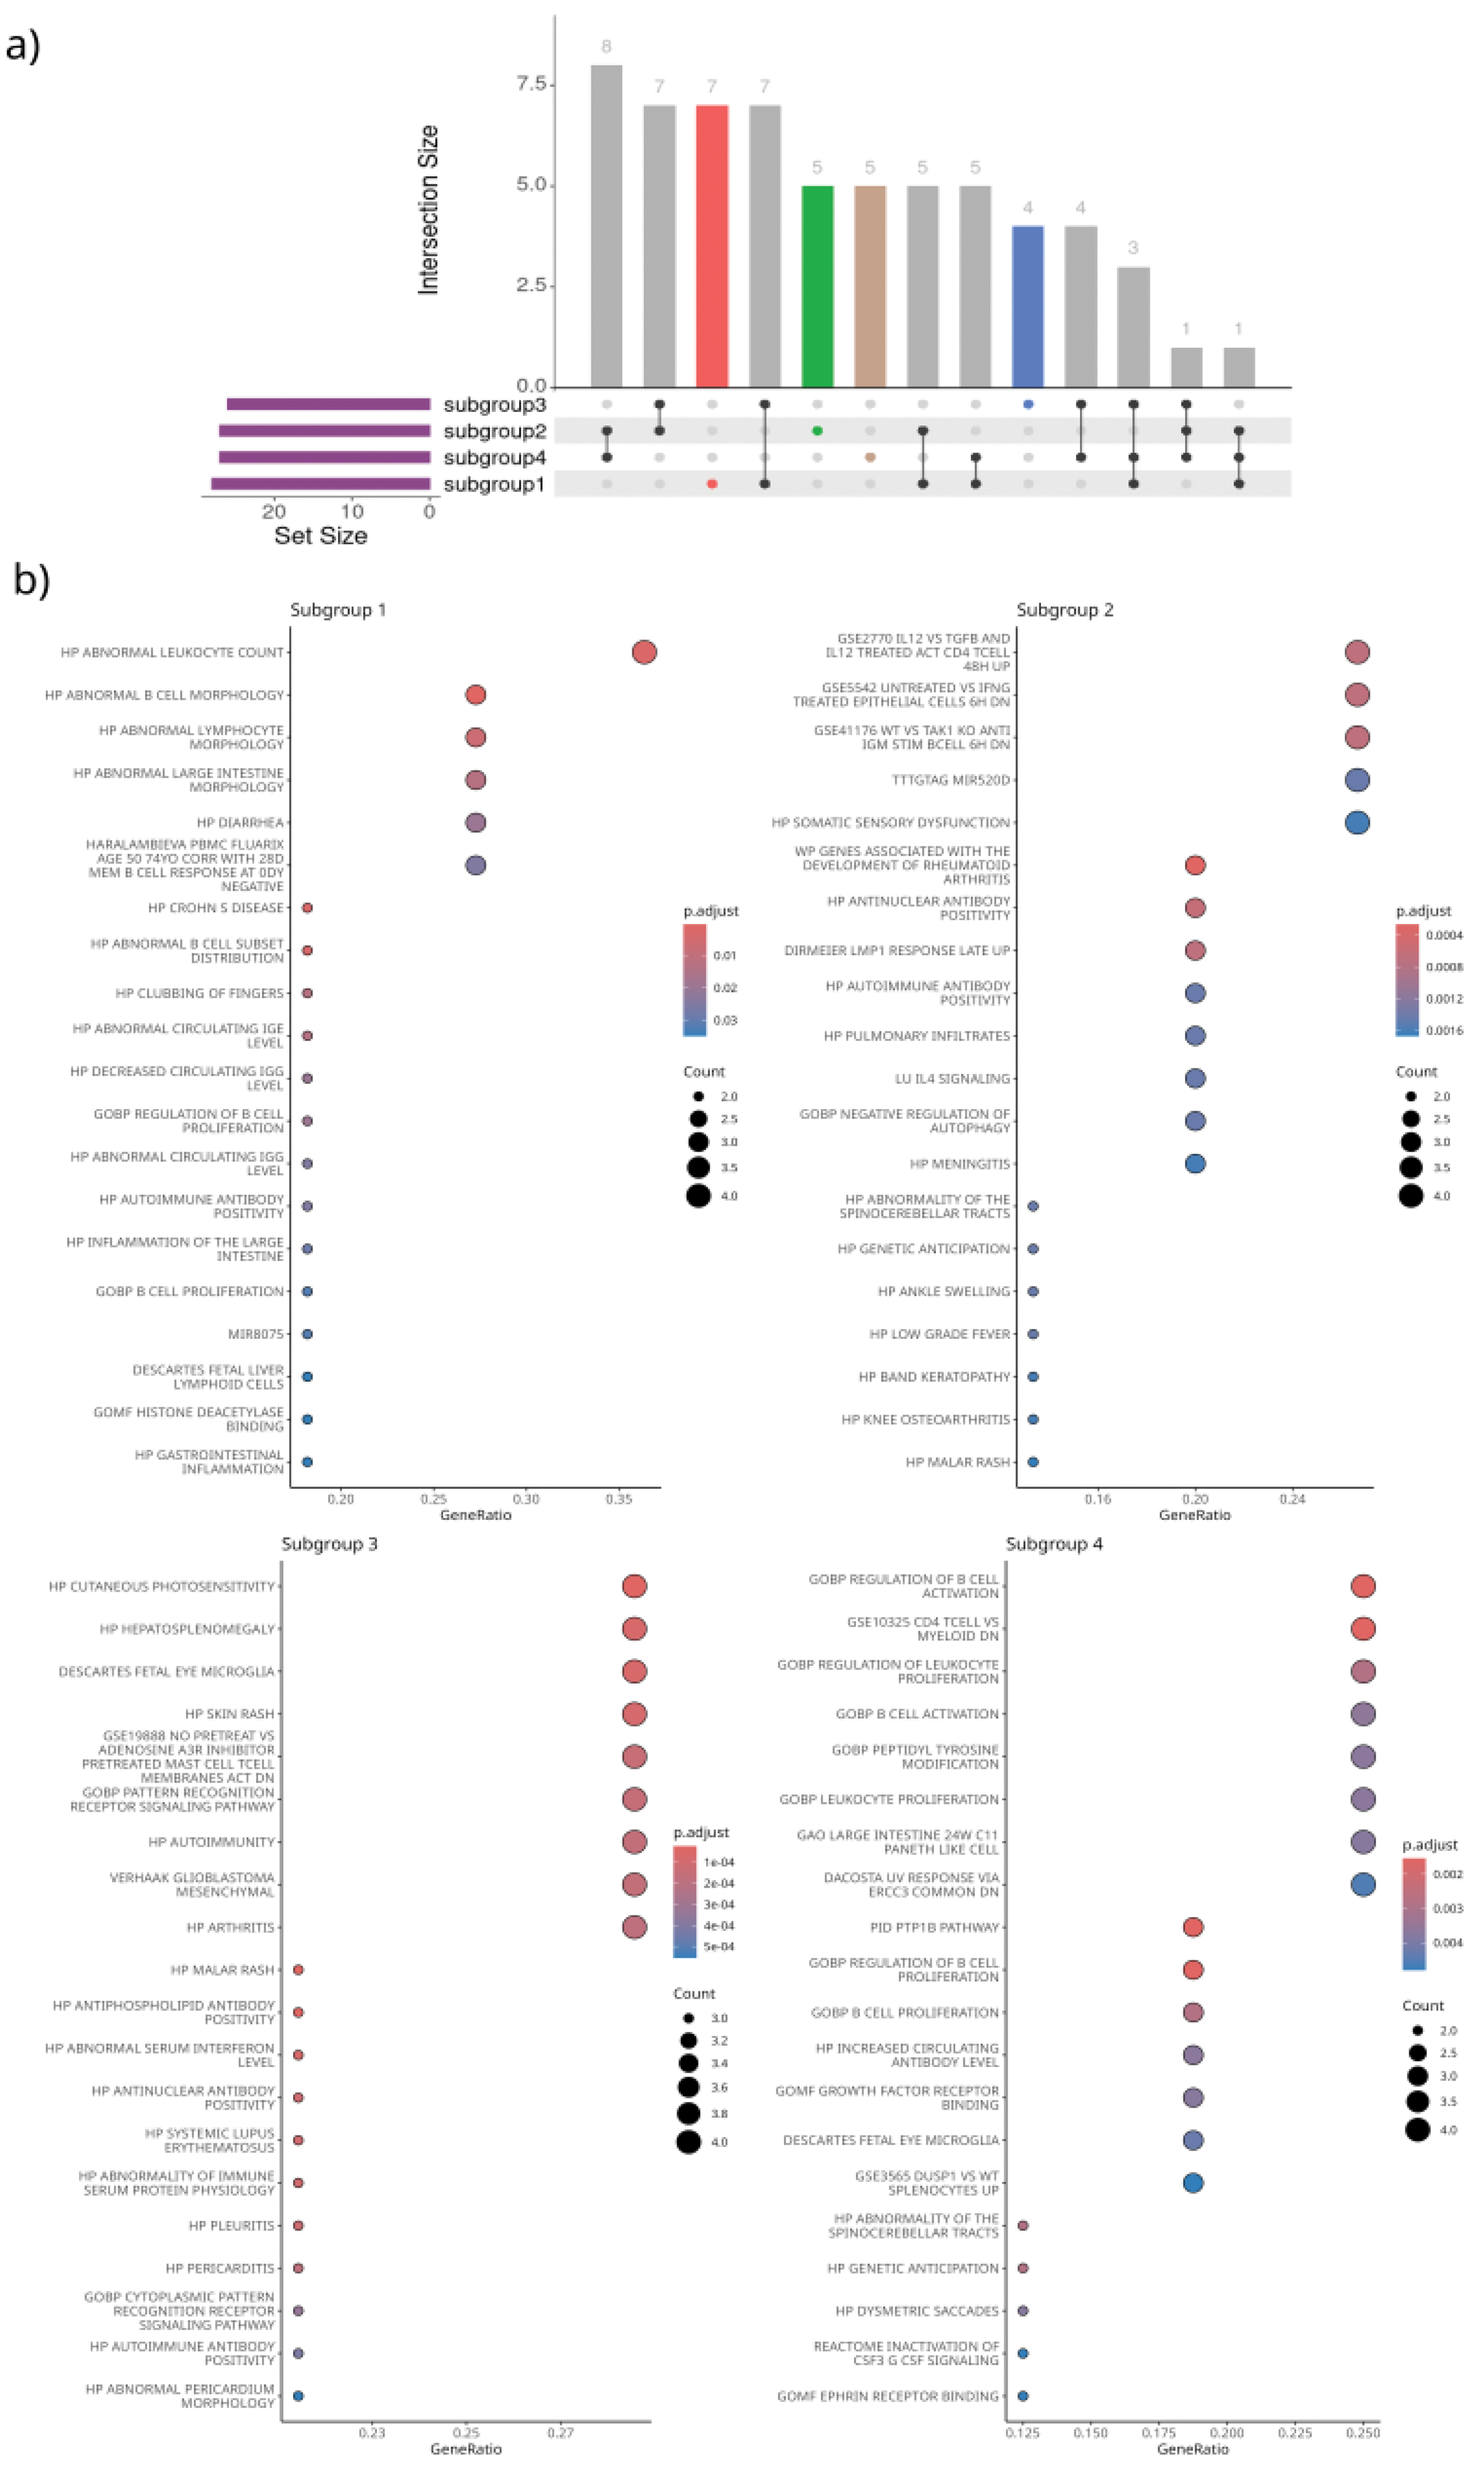
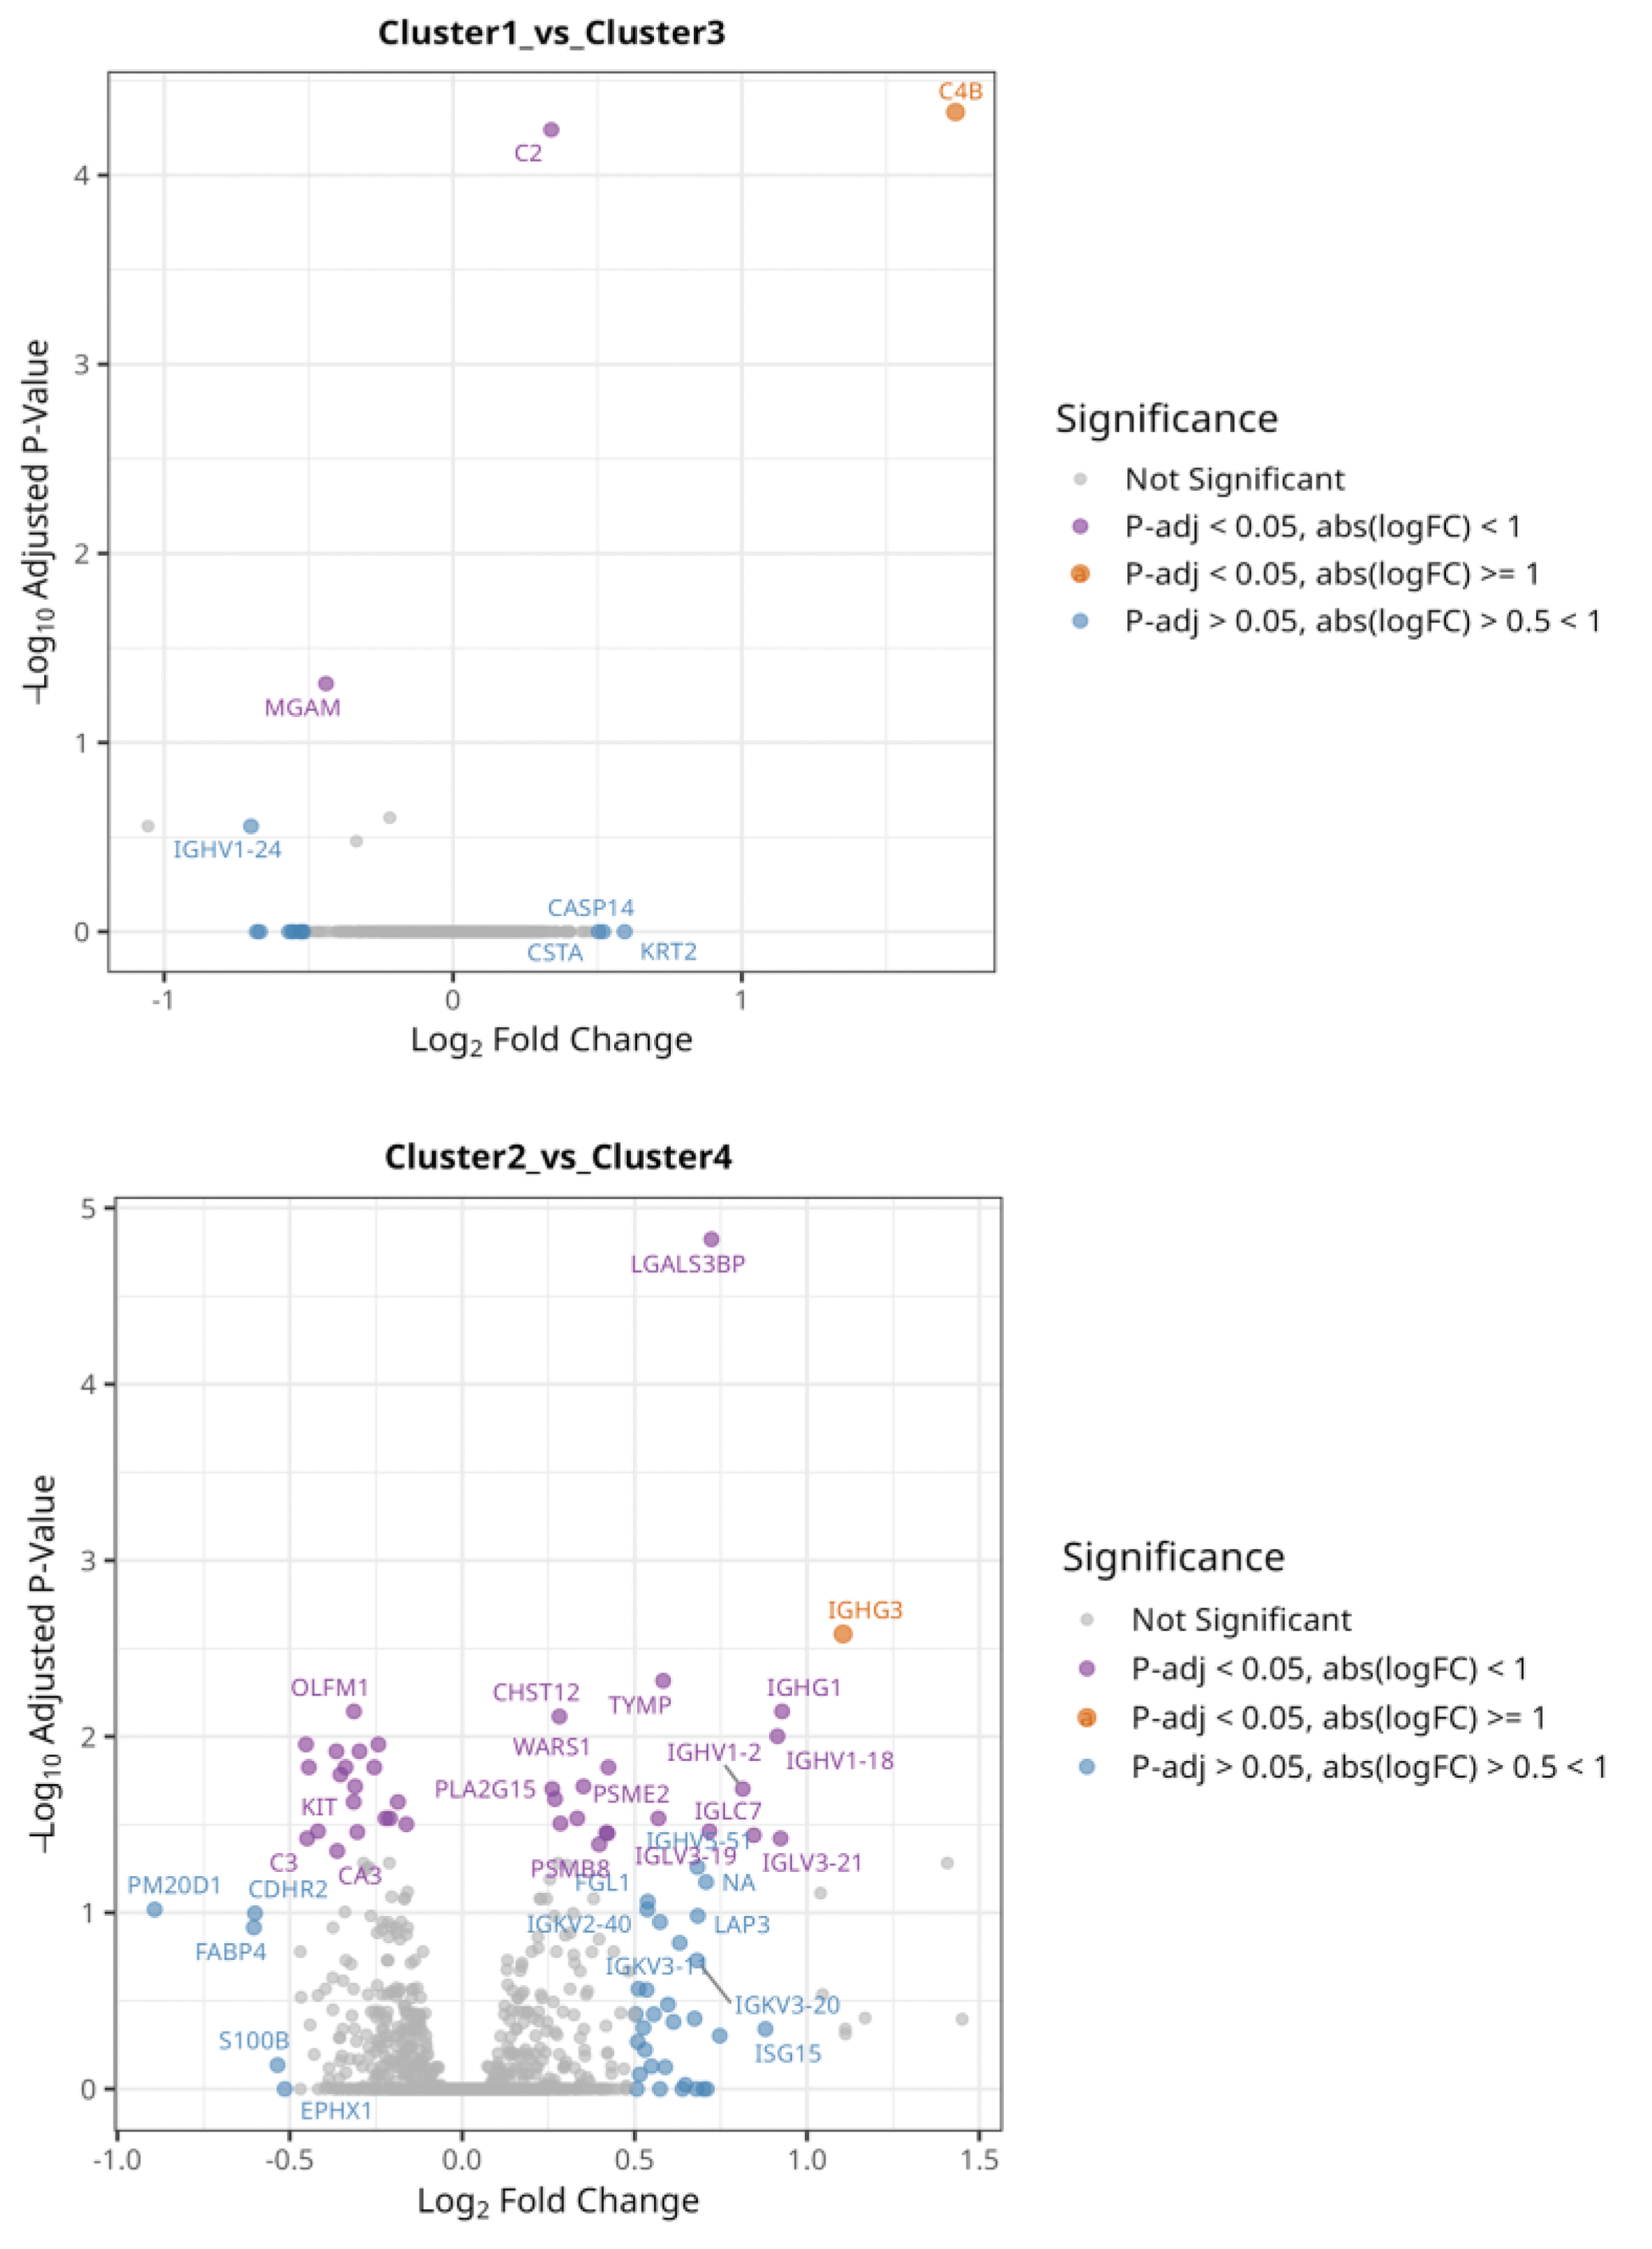
Results: We identified unique genetic variant sets for each subgroup (Figure 1A), which represent distinct pathogenic pathways; this supports our hypothesis of distinct underlying genetic mechanisms across patient subsets. GSEA of subgroup-specific genetic variants identified significant enrichment in different pathways within subgroups (Figure 1B). For subgroup 1, pathways for abnormal leukocyte count (P-adj = 1.65e-03), abnormal B cell subset distribution (P-adj = 3.28e-04), and cutaneous photosensitivity (P-adj = 0.015) were overrepresented. Subgroup 2 showed enrichment in pathways related to rheumatoid arthritis development (P-adj = 1e-04), antinuclear antibody positivity (P-adj = 3e-04), and fatigue (P-adj = 1.3e-03). Subgroup 3 was associated with malar rash (P-adj = 1.7e-05) and aPL positivity (P-adj = 1.7e-05). For subgroup 4, significant pathways included regulation of B cell activation (P-adj = 2.5e-04) and proliferation (P-adj = 2.6e-06). Differential expression analysis of plasma proteins (n=2625) between the subgroups revealed that an isoform of Complement C4-B (C4B) was significantly overexpressed (P-adj 3.72e0-5) in subgroup 1 compared to subgroup 3, followed by C2, which indicates involvement of the complement system. Likewise, an isoform of Immunoglobulin heavy constant gamma 3 (IGHG3) was significantly overexpressed (P-adj 2.3e-03) in subgroup 2 compared to subgroup 4 (Figure 2).
a) SNP sets in and outside HLA region per patient subgroup. Colours highlight different patient subsets. b) Enrichment plots of subgroup-optimized genetic variants. The first 20 terms with an P-adj < 0.05 are shown.
Isoform of Complement C4-B (CB4) was significantly overexpressed (P-adj 3.72e-05, log2FC = 1.74) in subgroup 1 compared to subgroup 3. Similarly, Immunoglobulin heavy constant gamma 3 (IGHG3) was higher in subgroup 2 than in subgroup 4 (P-adj 2.3e-03, log2FC = 1.1).
Conclusion: Our targeted selection of genetic variants revealed unique variant sets that maximize the PRS for each SLE subgroup, reinforcing the presence of subgroup-specific pathogenic mechanisms. GSEA highlighted significant enrichment in pathways linked to both clinical manifestations and immune dysregulation, demonstrating the utility of subgroup-specific PRS in uncovering biologically meaningful patterns. The differential expression analysis of proteins further supports our hypothesis, with subgroup-specific overexpression of complement system components (e.g., C4B in subgroup 1) and immunoglobulin isoforms (e.g., IGHG3 in subgroup 2), suggesting distinct immune activation profiles. These findings provide evidence that different genetic and pathogenic mechanisms underlie the antibody-defined SLE subgroups, with potential contributions from previously uncharacterized autoantibodies and B-cell involvement. Ongoing work will expand this analysis to evaluate whether optimized PRS per subgroup can better predict clinical manifestations compared to the global SLE PRS approaches, providing a foundation for subgroup-specific therapeutic strategies.
REFERENCES: [1] Diaz-Gallo LM, Oke V, Lundstrom E, Elvin K, Ling Wu Y, Eketjall S, et al. Four Systemic Lupus Erythematosus Subgroups, Defined by Autoantibodies Status, Differ Regarding HLA-DRB1 Genotype Associations and Immunological and Clinical Manifestations. ACR Open Rheumatol. 2022;4(1):27-39.
[2] Reid S, Alexsson A, Frodlund M, Morris D, Sandling JK, Bolin K, et al. High genetic risk score is associated with early disease onset, damage accrual and decreased survival in systemic lupus erythematosus. Ann Rheum Dis. 2020;79(3):363-9.
Acknowledgements: NIL.
Disclosure of Interests: Ana Cristina Gonzalez-Sanchez: None declared, Helena Idborg: None declared, Andreas Jonsen: None declared, Aleksandra Antovic: None declared, Anders Bengtsson: None declared, Agneta Zickert: None declared, Sarah Reid: None declared, Karine Chemin: None declared, Lars Ronnblom: None declared, Iva Gunnarsson: None declared, Gunnel Nordmark: None declared, Elisabet Svenungsson Author declares to have inherited shares of Astra Zeneca and Pfizer, Dag Leonard: None declared, Lina M. Diaz-Gallo: None declared.
© The Authors 2025. This abstract is an open access article published in Annals of Rheumatic Diseases under the CC BY-NC-ND license (