fetching data ... 
Background: HLA polymorphisms associated with rheumatoid arthritis (RA) susceptibility are also associated with severity. However, emerging evidence suggests that HLA-independent genetic mechanisms underpinning susceptibility to disease and its progression are different. Despite a plethora of reports on genetic associations with radiographic outcome in RA, the characterisation of biological mechanisms leading to poor outcome remains elusive, as most studies fail replication.
Objectives: To investigate non-HLA genetic mechanisms underlying radiographic severity in RA, by 1) conducting a systematic review of all reports on radiographic severity in RA across ethnicities, 2) providing an independent validation in a large cohort, 3) gaining biological insights into mechanisms of disease prognosis by functional annotation and pathway analysis.
Methods: A systematic review of publications reporting non-HLA genetic associations with radiographic severity in RA across ancestries was conducted in line with STROBE guidelines. Experimental validation was performed in the Norfolk Arthritis Register (NOAR), comprising 1884 RA patients followed prospectively for up to 10 years, with a total of 2,198 longitudinal radiographs of hands and feet, scored for the extent of radiographic damage according to the Larsen method. Genome-wide genotyping was performed on the Illumina Human Core Exome Array followed by genotype imputation against the European HRC Reference Panel up to a total of 7,461,030 Single Nucleotide Polymorphisms (SNPs) with a minor allele frequency (MAF) over 1%. Association testing with longitudinal outcome was performed with generalized estimating equation models for the presence of erosions and with generalised linear latent and mixed model with discrete random effects and 3 latent classes for Larsen score. Fine mapping of regions of interest was performed, together with functional annotations and estimation of functional impact with FUMA, PolyPhen2 and RegulomeDB.
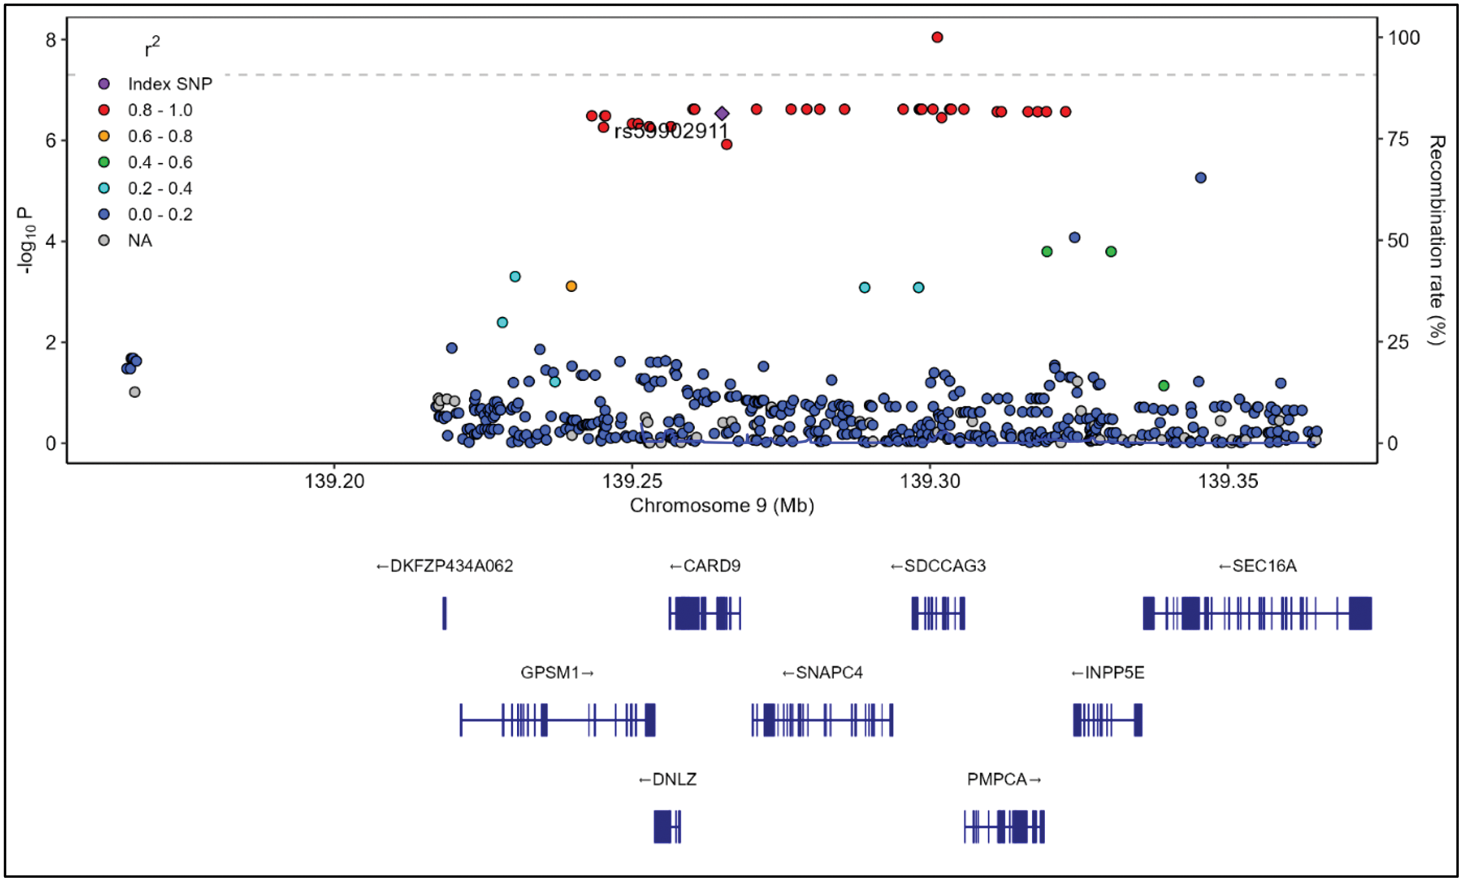
Results: Systematic review identified 102 publications reporting a total of 139 independent non- HLA associations with radiographic outcome. In NOAR, 16 independent SNPs (~12%) replicated with consistent direction of effect to the original publication, implicating adaptive immune processes (Th1, Th2 and Th17 pathways), cytokine regulation and osteoclast differentiation as mechanisms of disease prognosis. Among SNPs replicating, rs59902911, located in exon 5 of CARD9 , a locus not previously reported to be involved in RA susceptibility, was part of a 95% credible SNP set comprising 30 SNPs (Figure 1). We refined the association of rs59902911 to an intronic polymorphism within an active enhancer (rs78892335), achieving genome-wide significance with an effect size exceeding the minimal clinically important difference for each copy of the minor allele (4.78 Larsen units/copy; 95% CI 3.15; 6.41, p=9.01×10⁻⁹; Figure 1 and 2). This polymorphism is associated with the expression of CARD9 (expression quantitative trait locus - eQTL) in immune cells, including B cells, CD4 + and CD8 + T cells, monocytes and neutrophils. CARD9 plays an integral role in the immune system through upregulation of inflammatory cytokines such as IL-6, TNF-α and IFN-γ, and processes such as maturation of antigen presenting cells, activation of T cells, neutrophil recruitment and polarisation of macrophages.
Conclusion: We provide a comprehensive list of validated genetic associations with RA outcome and demonstrate that non- HLA severity polymorphisms, despite lack of association with disease susceptibility, can reach genome-wide significance and point towards genetic mechanisms of radiographic outcome independent of the HLA and anti-CCP status. This highlights the importance of dedicated outcome studies in identifying genetic markers for patient stratification in precision medicine for RA.
Fine-mapping of the association with radiographic outcome at the CARD9 locus. LocusZoom plot highlighting the index SNP, rs59902911, in purple. The dotted line refers to genome-wide significance. Each dot represents a SNP, colour-coded for the linkage disequilibrium to the index SNP. Y axis represents the absolute value of the log 10 of the p-value for the association with Larsen score. Chromosomal positions are presented on the X axis together with the genetic structure of the region (genes, exons, introns, direction of transcription and gene names).
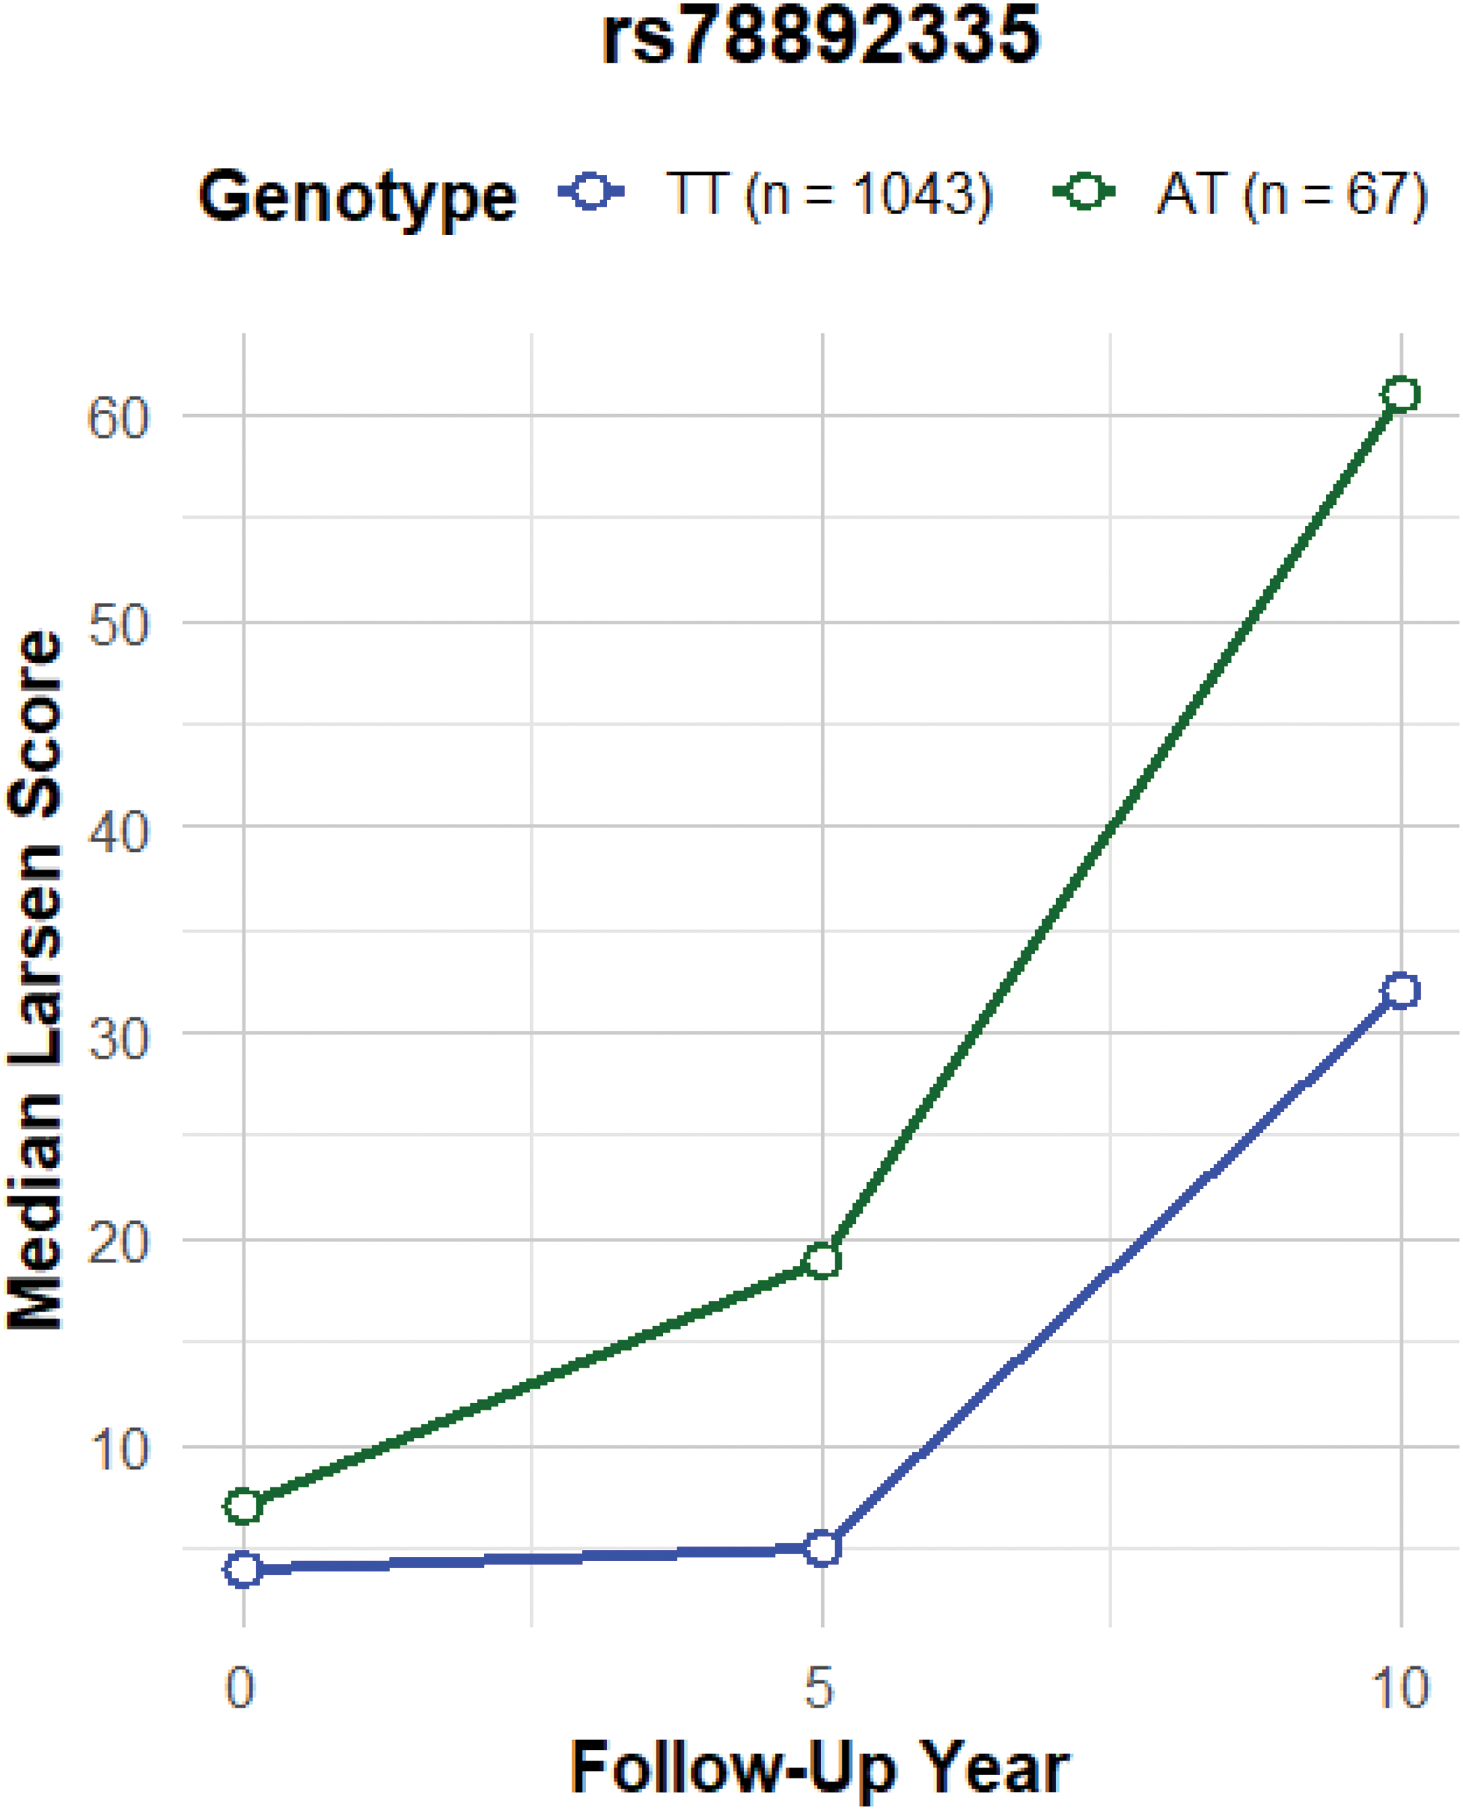
Median Larsen score over time according to genotype of rs78892335. Median Larsen score at follow up years 0, 5 and 10 of patients with different genotypes of rs78892335, which is regulating CARD9 expression. TT denotes those patients homozygous for the major allele, and AT are heterozygous. Patients with a copy of the minor allele have more severe radiographic changes compared to those without.
REFERENCES: NIL.
Acknowledgements: All other NOAR collaborators. Lysette Marshall is funded by the Medical Research Council (MRC) through the MRC Doctoral Training Partnership (grant reference: MR/W007428/1). Seema Sharma is funded by the Medical Research Council (MRC) through the Clinical Research Training Fellowship (grant reference: MR/Z505080/1). Rachel knevel is supported by the following grants: European Union’s Horizon programme for Europe research and innovation (101080711 (SPIDERR)); ZonMw Open Competitie (9120012110075); ZonMw Klinische Fellow (40-00703-97-19069).
Disclosure of Interests: None declared.
© The Authors 2025. This abstract is an open access article published in Annals of Rheumatic Diseases under the CC BY-NC-ND license (