fetching data ... 
Background: Systemic sclerosis (SS) is a rare autoimmune disease characterized by progressive fibrosis of the skin and internal organs, including the lungs and kidneys. Classic pathophysiology involves a triad of endothelial injury, chronic inflammation, and excessive extracellular matrix deposition, which collectively drive fibrosis and organ dysfunction [1]. Early diagnosis is challenging due to the nonspecific nature of initial symptoms, while current treatments primarily aim to slow disease progression rather than reverse existing damage [2].
Recent advances in transcriptomic profiling have enabled the identification of molecular pathways and biomarkers associated with SS. These approaches provide a deeper understanding of disease mechanisms and hold promise for improving diagnostic accuracy and therapeutic strategies [3]. This study analyzed transcriptomic data to identify key diagnostic and therapeutic biomarkers in peripheral blood, with the goal of enhancing early detection and management of SS.
Objectives: To identify key hub genes (HGs) involved in the pathogenesis of systemic sclerosis and assess their diagnostic potential in peripheral blood samples.
Methods: Transcriptomic profiles from skin biopsies of systemic sclerosis (SS) patients were analyzed using datasets GSE95065, GSE125362, GSE32413, and GSE130955 obtained from the Gene Expression Omnibus platform. Differentially expressed genes (DEGs) were identified using a false discovery rate (FDR) < 0.05 and log2 fold-change thresholds of >1 for upregulation and <-1 for downregulation. Functional enrichment analysis of DEGs was performed using the Metascape online tool. Shared DEGs were visualized using a Venn diagram and analyzed for hub genes (HGs) using the Cytoscape platform with five algorithms: Degree, DMNC, Radiality, Eccentricity, and Stress. Receiver operating characteristic (ROC) curves were constructed using mean fluorescence intensity (MFI) values from the GSE45536 dataset, which contains transcriptomic profiles from peripheral blood samples of SS patients. Logistic regression analysis was used to assess the association between HG expression and disease outcomes.
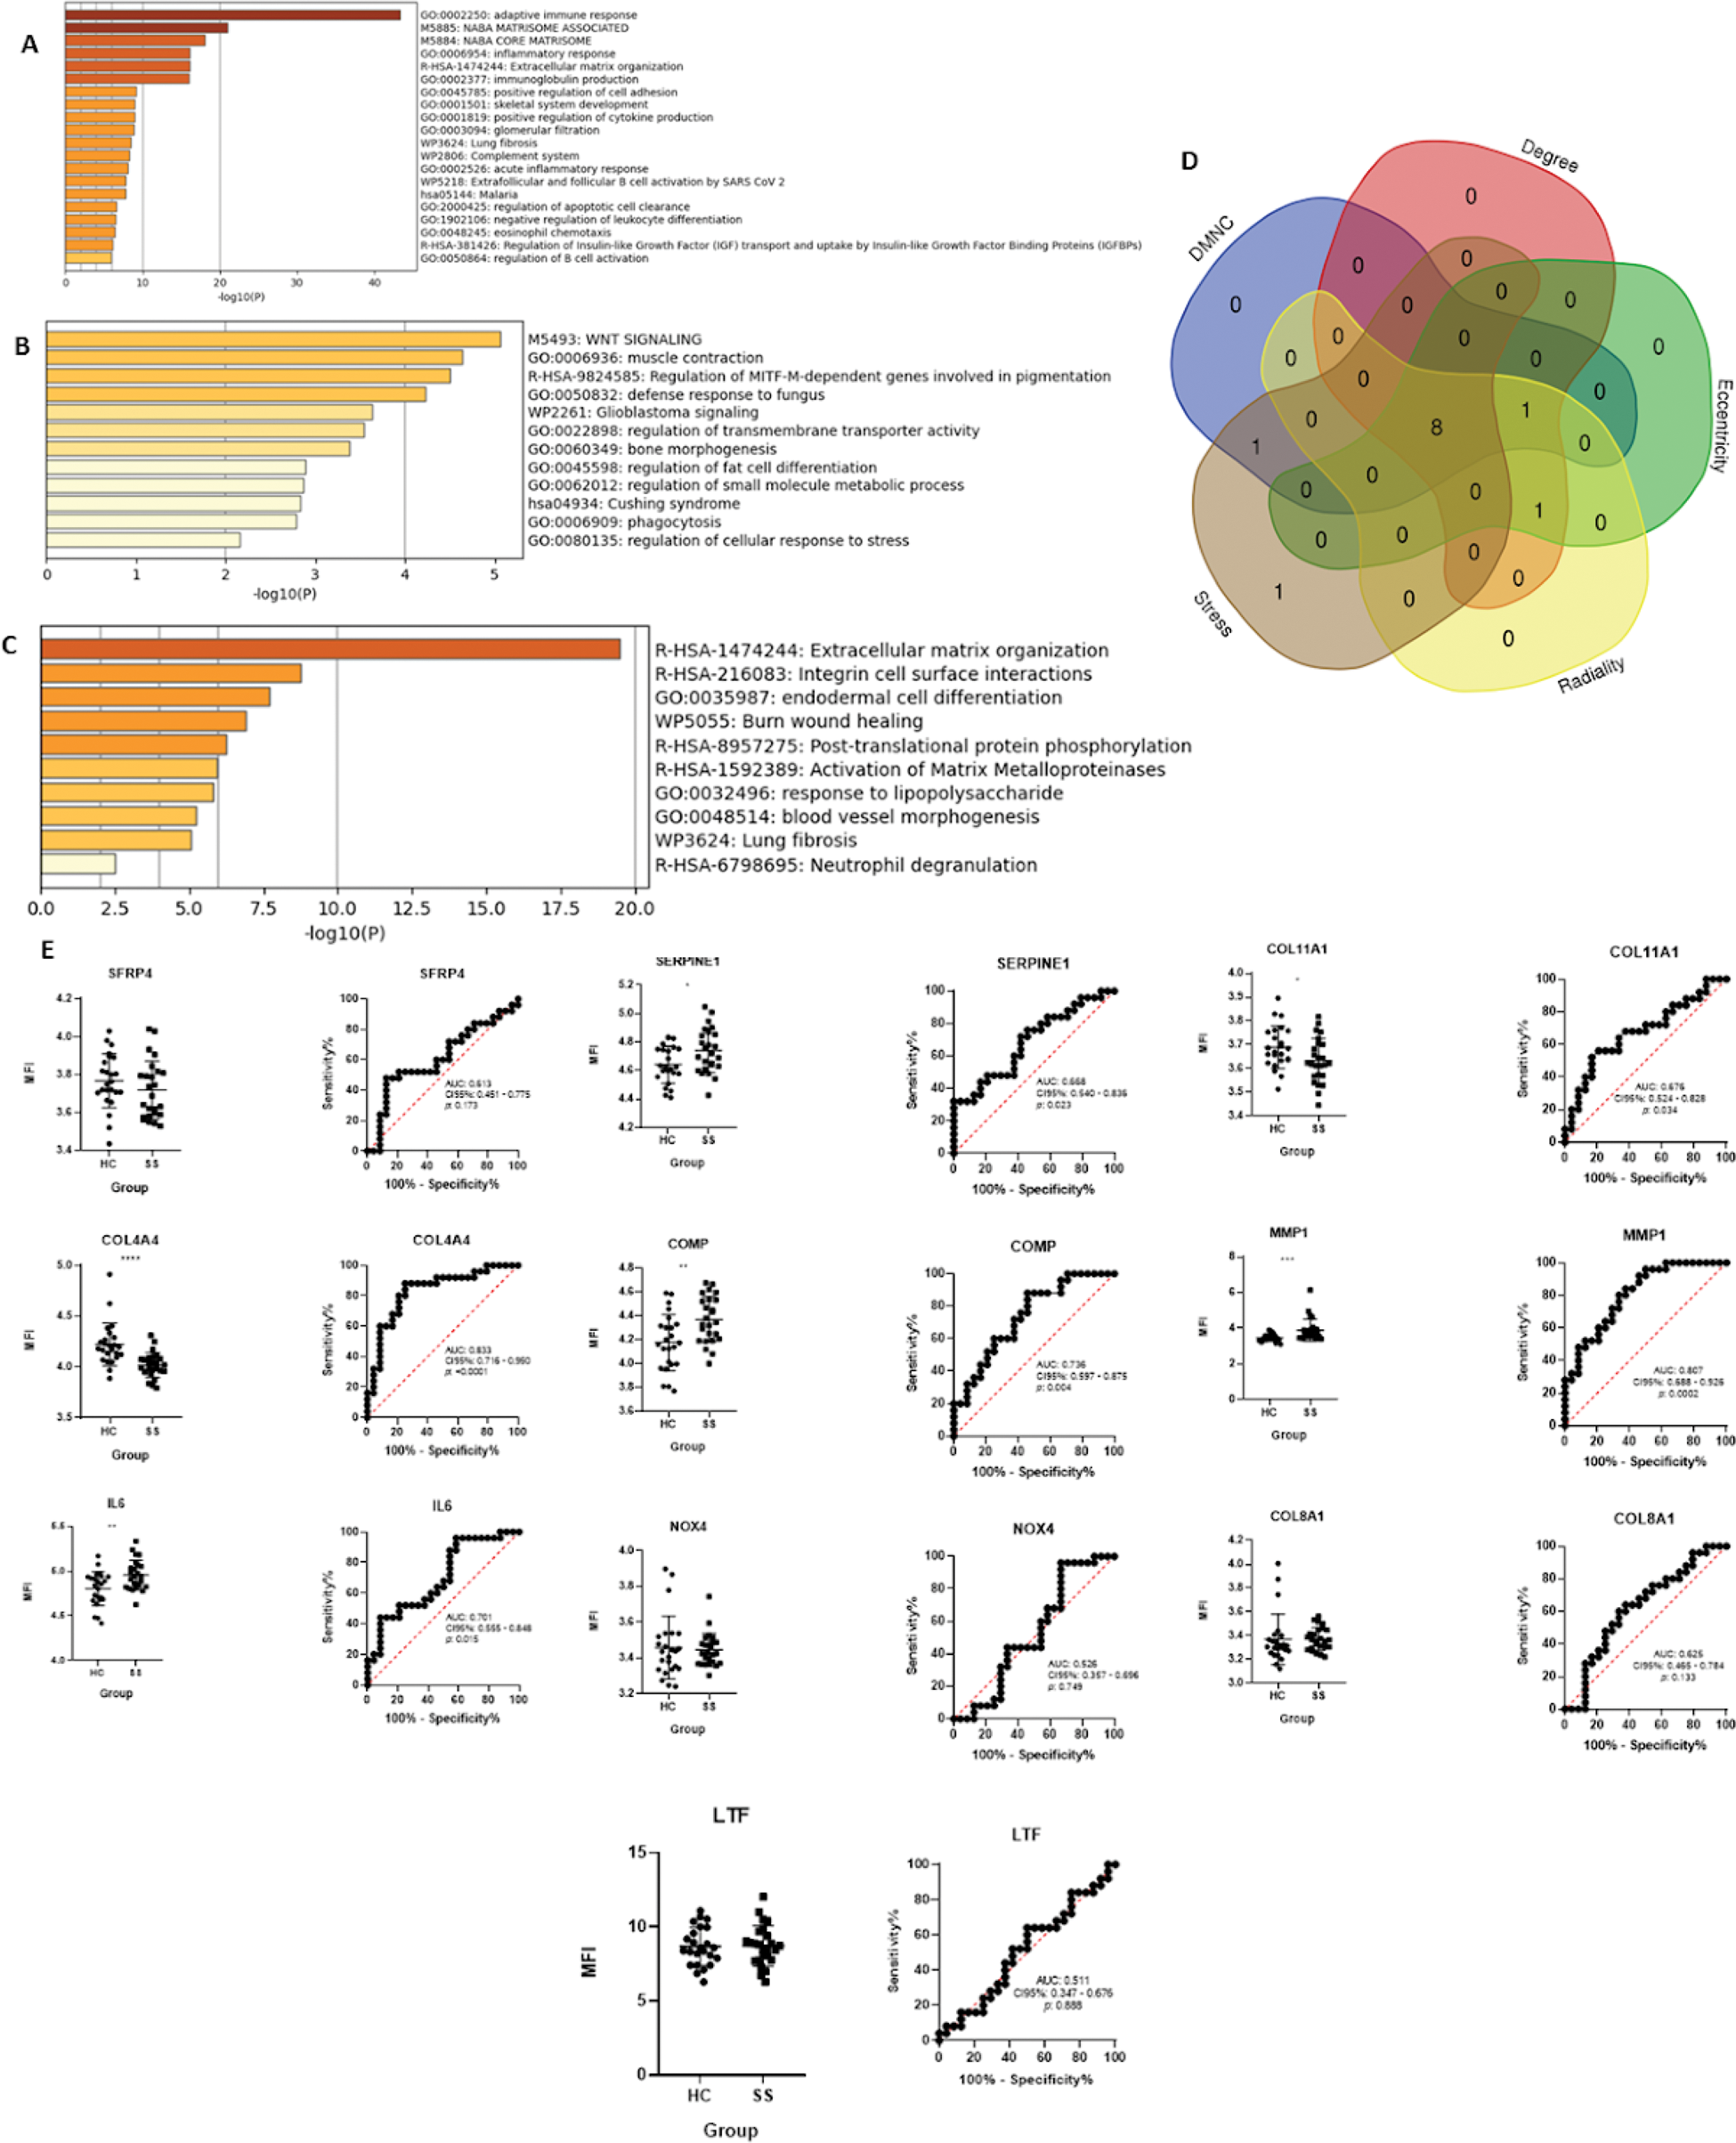
Results: A total of 189 upregulated and 44 downregulated DEGs were identified, with 17 overlapping upregulated genes and 2 overlapping downregulated genes across datasets. Co-expression analysis identified an additional 20 co-expressed genes. Functional enrichment analysis of the upregulated, downregulated, and co-expressed genes highlighted pathways related to extracellular matrix organization and inflammatory responses (Figure 1A, 1B, and 1C). Ten HGs were identified across at least two algorithms. Of these, COL4A4 , IL6 , SERPINE1 , COMP , COL1A1 , and MMP1 showed significant differences in MFI values between patients and controls. ROC curve analysis demonstrated that COL4A4 , IL6 , COMP , and MMP1 had areas under the curve (AUC) indicating strong diagnostic potential (Figure 1E). Logistic regression analysis revealed that IL6 , SERPINE1 , COMP , and MMP1 were positively associated with SS, while COL4A4 and COL11A1 were negatively associated (Table 1). These findings suggest that these genes play a crucial role in SS pathogenesis and could serve as candidate biomarkers.
Functional enrichment analysis and diagnostic potential of hub genes in systemic sclerosis. (A-C) Functional enrichment analysis of upregulated (A), downregulated (B), and co-expressed genes (C) reveals pathways related to extracellular matrix remodeling and inflammation. (D) Hub genes were identified using five algorithms (DMNC, Degree, Radiality, Eccentricity, and Stress), with 10 overlapping genes. (E) Receiver operating characteristic (ROC) curves and mean fluorescence intensity (MFI) values for key hub genes. Statistical comparisons were performed using Student’s t-test or Mann-Whitney U test. Significance is indicated by asterisks: *p < 0.05, **p < 0.01, ***p < 0.001, ****p < 0.0001.
The association between HG’s expression and disease state outcome was evaluated with a logistic regression analysis.
| Protein | OR | CI95% | p |
|---|---|---|---|
| SRFP4 | 0.960 | 0.002 - 4.978 | 0.245 |
| COL4A4 | <0.001 | <0.001 - 0.20 | 0.001 |
| IL6 | 166.325 | 3.165 - 8740.742 | 0.011 |
| SERPINE1 | 140.176 | 1.728 - 11372.629 | 0.028 |
| COMP | 67.290 | 3.176 - 1425.629 | 0.007 |
| NOX4 | 0.474 | 0.008 - 29.676 | 0.724 |
| COL11A1 | 0.001 | <0.001 - 0.814 | 0.044 |
| MMP1 | 132.154 | 4.583 - 3810.969 | 0.004 |
| COL8A1 | 1.152 | 0.035 - 38.388 | 0.937 |
| LTF | 1.030 | 0.669 - 1.586 | 0.893 |
Odds ratios (OR) and 95% confidence intervals (CI) are reported, with p-values indicating significance.
Conclusion: This meta-analysis identified key hub genes involved in the pathogenesis of systemic sclerosis, with IL6 , SERPINE1 , COMP , and MMP1 showing positive associations with disease state and strong diagnostic potential. Conversely, COL4A4 and COL11A1 were negatively associated with systemic sclerosis. The findings highlight the need for further validation of these biomarkers in larger cohorts and underscore the current lack of reliable markers for detecting early pulmonary involvement in SS. Identifying robust biomarkers remains critical for improving early diagnosis and management of this complex disease.
REFERENCES: [1] Gabrielli, A., Avvedimento, E. V., & Krieg, T. (2009). Scleroderma.
New England Journal of Medicine, 360
(19), 1989-2003.
[2] Denton, C. P., & Khanna, D. (2017). Systemic sclerosis.
The Lancet, 390
(10103), 1685-1699.
[3] Assassi, S., Swindell, W. R., Wu, M., Tan, F. D., Khanna, D., Furst, D. E.,. & Mayes, M. D. (2015). Dissecting the heterogeneity of skin gene expression patterns in systemic sclerosis.
Arthritis & Rheumatology, 67
(11), 3016-3026.
Acknowledgements: We’d like to thank the Mexican National Council of Humanities, Science and Technology (CONAHCYT) for providing the academic grant that made this research possible. Grant ID: PCC-2022-320697.
Disclosure of Interests: None declared.
© The Authors 2025. This abstract is an open access article published in Annals of Rheumatic Diseases under the CC BY-NC-ND license (