fetching data ... 
Background: Cartilage Acidic Protein (CRTAC1), a cartilage-associated protein produced by chondrocytes, is associated with the pathophysiology of osteoarthritis (OA). Elevated CRTAC1 levels observed in both cartilage and plasma samples from OA patients suggest its potential to predict OA onset or progression, including the likelihood of eventual joint replacement.
Objectives: This study aimed to evaluate the profile of CRTAC1 in the synovial fluid (SF) and plasma of OA patients compared to healthy controls (HC). We assessed CRTAC1’s specificity by comparing with other rheumatic and musculoskeletal diseases (RMDs), and we explored differences among OA subtypes. Additionally, we investigated the link between inflammation and CRTAC1 in OA and examined miRNAs potentially regulating CRTAC1 expression.
Methods: A total of 560 individuals participated in this study, including 73 paired SF and plasma samples from OA patients. Knee radiographs were evaluated using the Kellgren-Lawrence grading scale. CRTAC1 levels were measured using mass spectrometry and validated via IQ-ELISA. Pro-inflammatory 27-plex assays were also validated through IQ-ELISA. miRNA sequencing was followed by digital PCR validation.
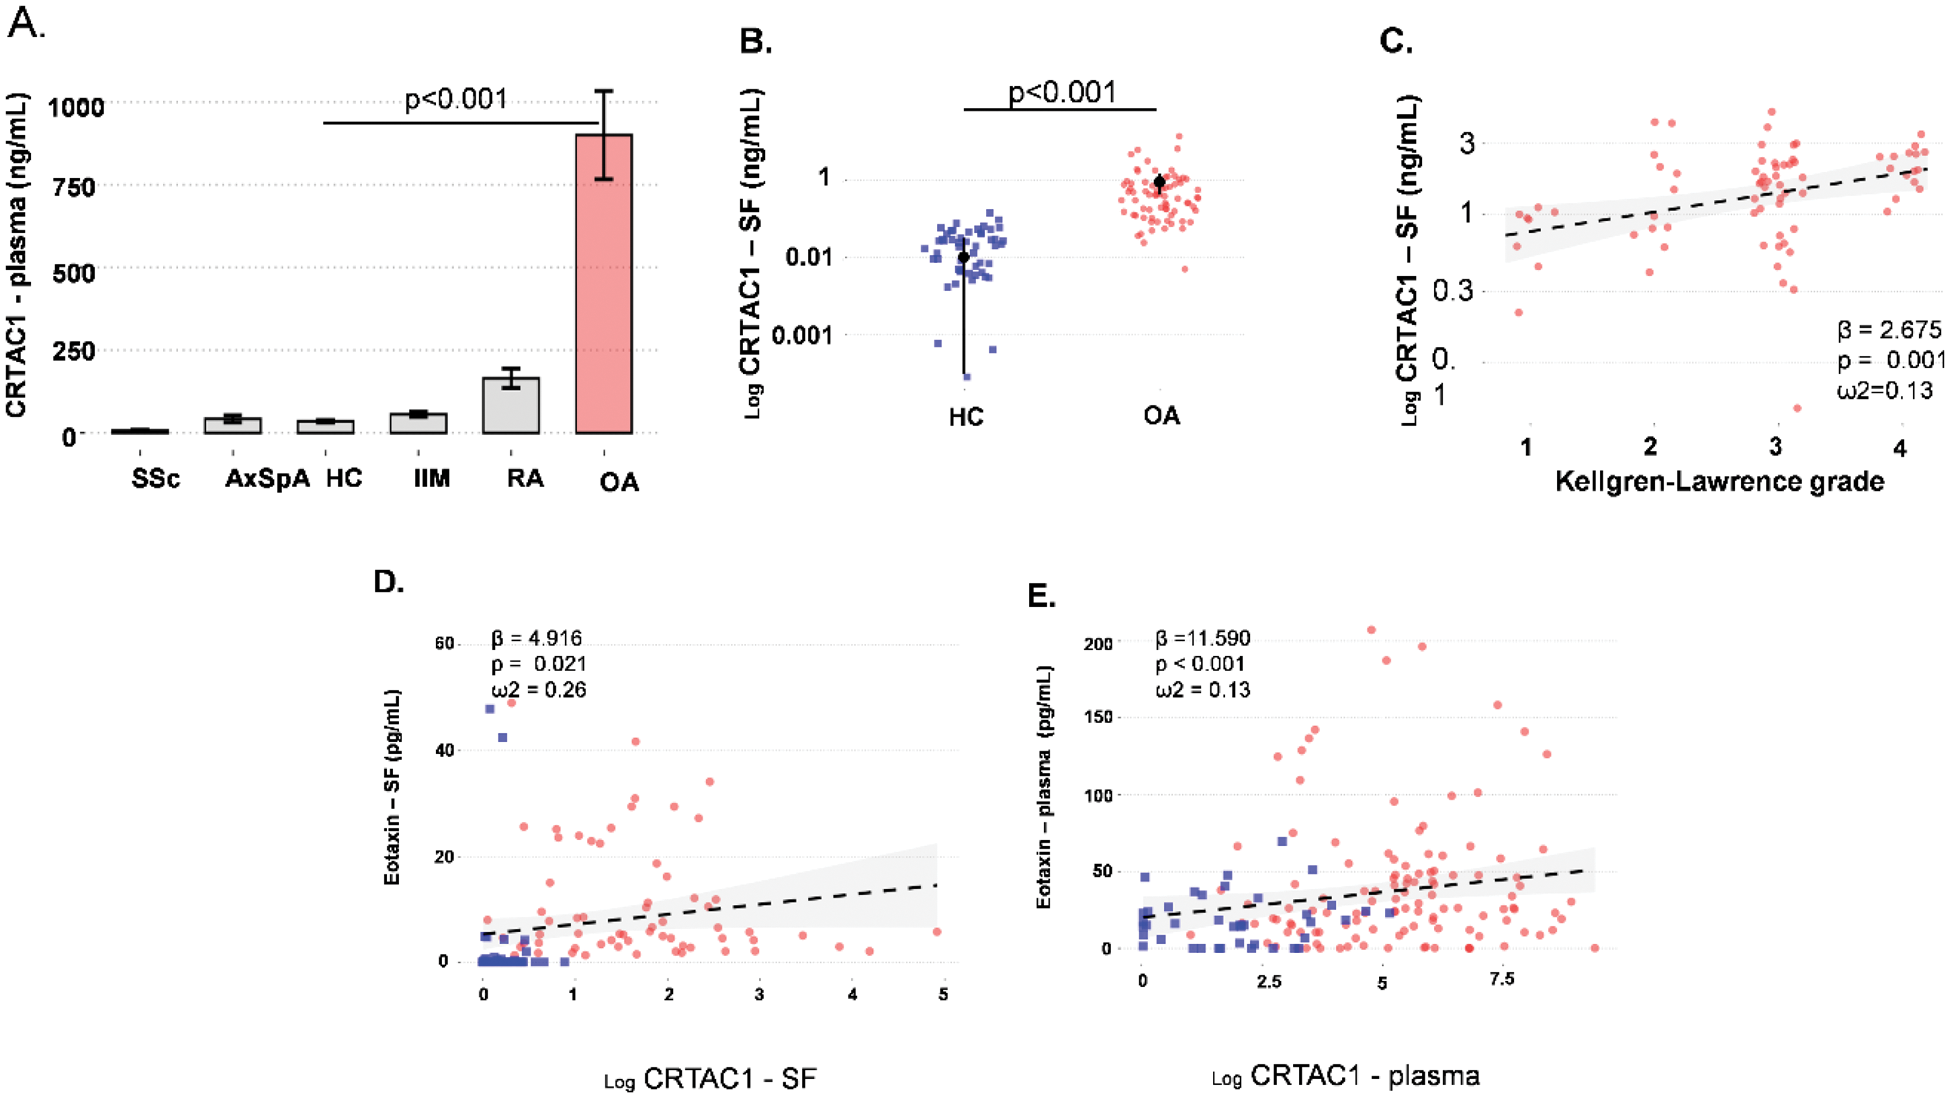
Results: CRTAC1 levels were significantly higher in OA patients’ SF and plasma compared to HC (p < 0.001 for both), with greater concentrations in plasma. CRTAC1 in SF, but not in plasma, correlated with OA severity (p=0.001). Compared with other RMDs, CRTAC1 in plasma was specific for OA but did not distinguish among OA subtypes. We also identified an association between CRTAC1 and eotaxin in SF (p=0.021) and plasma (p=0.015). miR-10a-5p (p=0.003), miR-107 (p=0.104), and miR-186-5p (p<0.001) were downregulated in OA and inversely associated with CRTAC1 in SF (Table 1).
Conclusion: CRTAC1 has emerged as a potential biomarker for OA, with SF levels linked to disease severity and inflammation. Additionally, the identified miRNAs may play a role in regulating CRTAC1, contributing to OA progression. Although further research is needed to understand the mechanism of CRTAC1 in OA and its therapeutic prospects, our results indicate its potential as a biomarker of OA severity.
(A) Plasma concentrations of CRTAC1 in OA patients compared to HC. The p-values were computed by Wilcox’s robust statistics, with p < 0.001. This analysis was adjusted for age and BMI. Whiskers in the boxplots display the range of data within 1.5 times the IQR from the first and third quartiles. (B) SF concentration of CRTAC1 in OA patients compared to HC. The p-values were computed using estimated marginal means with a 95% confidence interval adjusted for age and BMI. (C) Linear modeling demonstrating the association between CRTAC1 levels in SF and OA severity, adjusted for age, BMI, and the total number of OA-affected joints. (D) Age- and BMI-adjusted linear modeling demonstrating a positive association between eotaxin and CRTAC1 in SF and (E) in plasma.
Comparison of miR-107, miR-10a-5p, and miR-186-5p levels in SF between the OA and HC groups. P-values were computed using estimated marginal means with a 95% confidence interval, adjusted for age and BMI. Next, BMI- and age-adjusted linear modeling indicating a negative association between selected miRNAs and CRTAC1 levels in SF, and OA severity.
| miRNA | OA vs. HC | Association with CRTAC1 | Association with OA severity | |||||
|---|---|---|---|---|---|---|---|---|
| p-value | Ct | p-value | β | ω | p-value | β | ω | |
| miR-10a-5p | 0.003 | -12.4 | 0.007 | -3.0 | 0.24 | 0.001 | -3.6 | 0.33 |
| miR-107 | 0.104 | -3.0 | 0.012 | -2.8 | 0.21 | 0.008 | -2.9 | 0.23 |
| miR-186-5p | <0.001 | -36.7 | 0.036 | -2.3 | 0.17 | 0.040 | -2.2 | 0.13 |
REFERENCES: [1] Styrkarsdottir U, Lund SH, Thorleifsson G, Saevarsdottir S, Gudbjartsson DF, Thorsteinsdottir U, et al. The CRTAC1 protein in plasma associates with prevalent osteoarthritis and predicts future risk as well as progression to joint replacements – Results from the UK Biobank resource. Arthritis & Rheumatology. 2022 Oct 14;0–1.
[2] Chondrocyte secreted CRTAC1: A glycosylated extracellular matrix molecule of human articular cartilage. Matrix Biology. 2007;26(1):30–41.
Acknowledgements: This work is supported by GAUK-266523, MHCR 023728, NW24-10-00395, SVV 260638, and BBMRI-CZ LM2023033.
Disclosure of Interests: None declared.
© The Authors 2025. This abstract is an open access article published in Annals of Rheumatic Diseases under the CC BY-NC-ND license (