fetching data ... 
Background: Rheumatic conditions including rheumatoid arthritis (RA), osteoarthritis (OA) and fibromyalgia (FM) enhance cardiovascular disease (CVD) risk. We previously reported that the Framingham score performs better than the Systemic Coronary Risk Evaluation (SCORE) in identifying Caucasian RA patients with high risk atherosclerosis [1]. This finding was validated in a Spanish cohort of RA patients [1]. In 2021, the thoroughly calibrated and validated SCORE2 was introduced [2]. The SCORE 2 was shown to improve the identification of persons with high CVD risk in the European population. Whether SCORE2 is less, equal or more useful than the Framingham score in the identification of high risk atherosclerosis among inflammatory and non-inflammatory rheumatic conditions is uncertain.
Objectives: Herein, we compared the predictive capabilities of SCORE2 and the Framingham score in identifying high risk atherosclerosis among patients with RA, OA or FM.
Methods: We evaluated 294 consecutive patients aged ≥40 years. These included 90 with RA, 163 with OA and 41 with FM; 72.7% were white, 17.8% Asian, 9.2% black and 0.3% of mixed ancestry. Demographic characteristics and major traditional risk factors including lipid, blood pressure, glucose and smoking variables were recorded. The SCORE2 and Framingham score were calculated. Plaque prevalence was assessed using high resolution ultrasound of both the extracranial carotid tree and femoral arteries. The associations of SCORE2 and Framingham score with carotid or/and femoral artery plaque were determined using receiver-operating characteristic (ROC) curves. The areas under the curves (AUC) were compared.
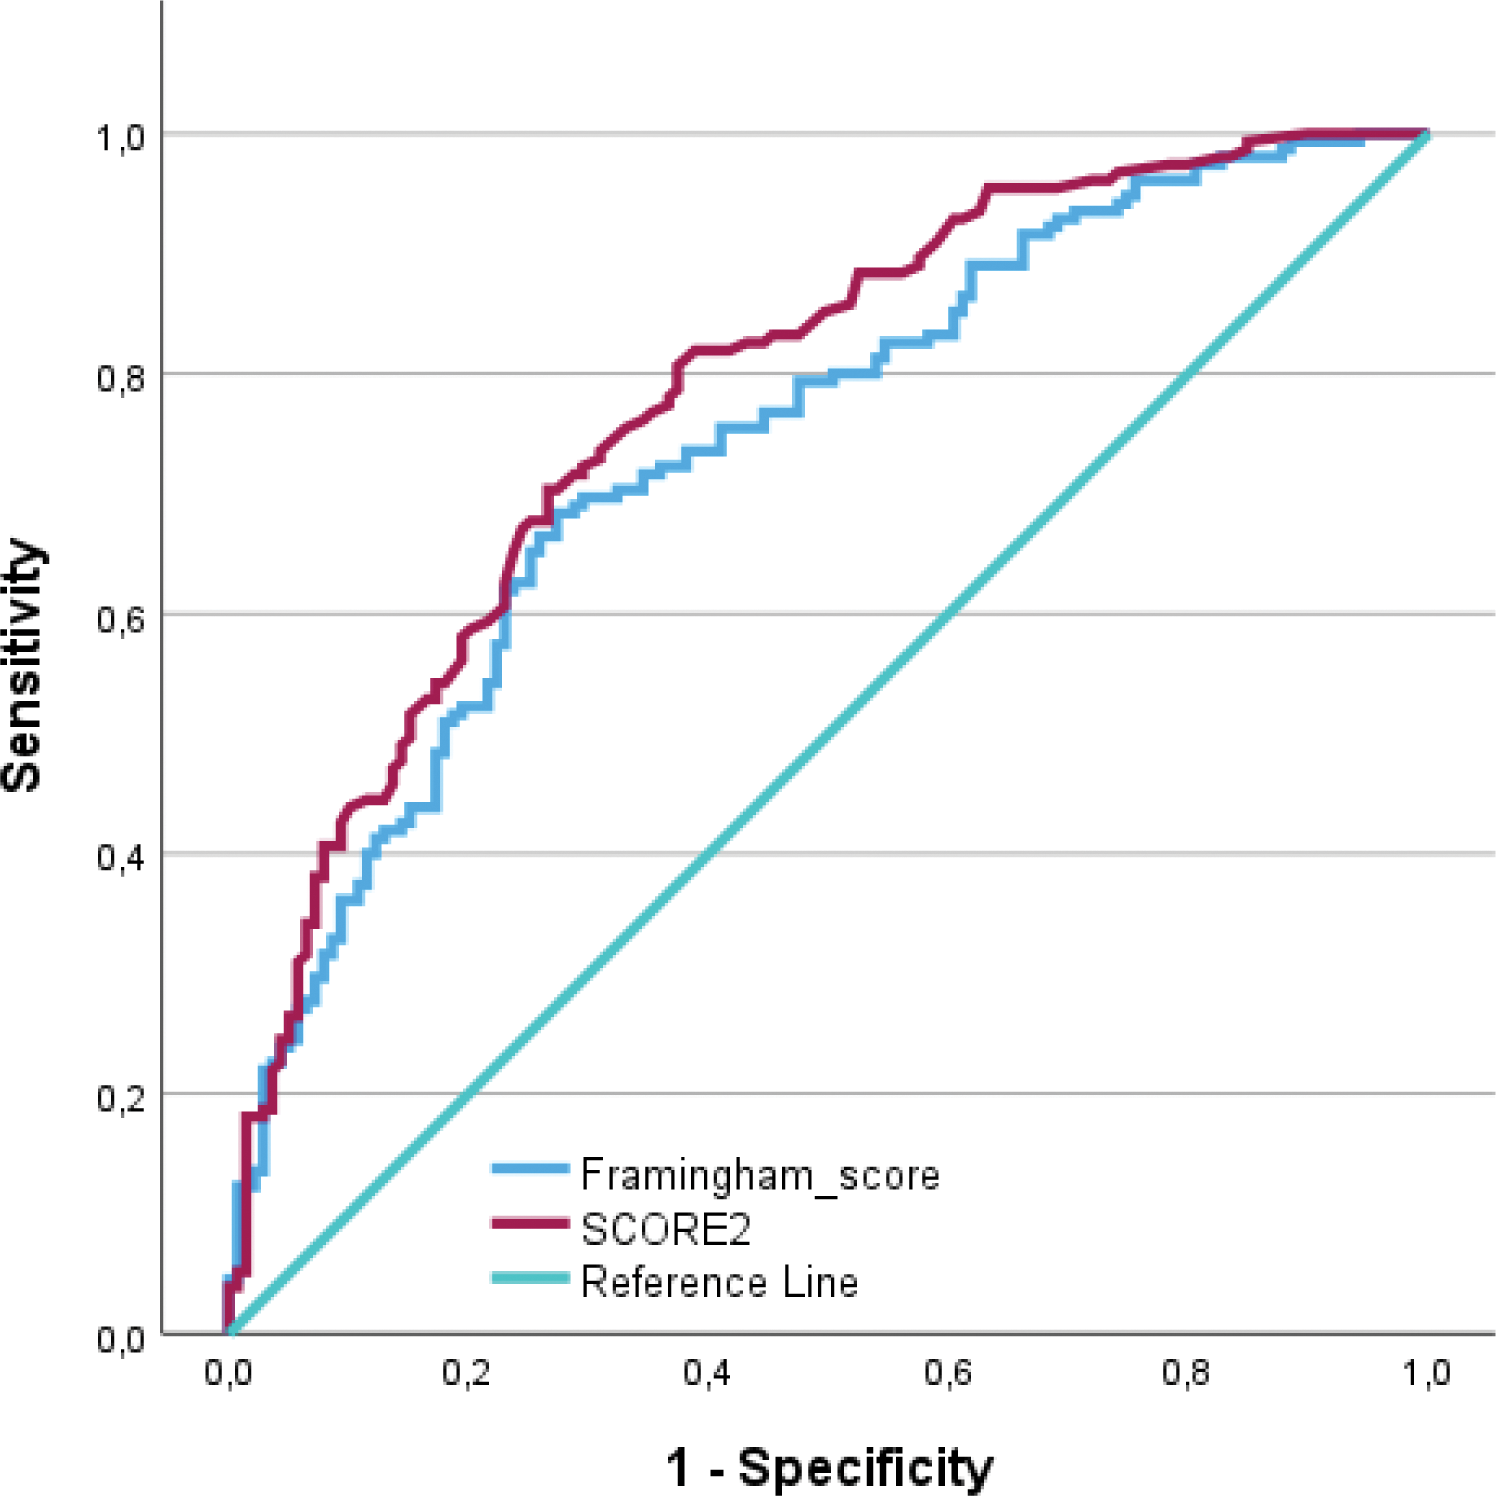
Results: Overall, 155 (52.7%) of the enrolled patients had carotid or/and femoral artery plaque. In age, sex and black population origin adjusted regression models, the prevalence of carotid or/and femoral artery plaque did not differ among RA, OA and FM patients (intergroup comparison p=0.412 to 0.990). As shown in Figure 1, the SCORE2 performed significantly better than the Framingham score in identifying carotid or/and femoral artery plaque. In subgroup analysis, the AUCs for SCORE2 were larger than those for Framingham score in RA (0.80 versus 0.73), OA (0.78 versus 0.74) and FM patients (0.76 versus 0.70). Differences in the distribution of cardiovascular risk categories between Framingham score and SCORE2 are given in Table 1. The Framingham score categorizes CVD risk as low, moderate or high whereas SCORE2 score classifies patients at low or moderate, high or very high CVD risk. According to the Framingham score, only 24 (8.1%) patients were at high CVD risk; by comparison, SCORE2 classified 183 (62.2%) patients at high or very high risk. This difference was significant at p<0.001. The same pattern was observed in RA (5 (5.5%) versus 55 (60.4%)), OA (19 (11.8%) versus 113 (70.2%)) and FM patients (0 (0%) versus 14 (35.0%)). Of the patients at low or moderate risk according to SCORE2 and Framingham score, plaque was detected in 29.7% and 49.6%, respectively (p=0.004).
Conclusion: SCORE2 performs significantly better than the Framingham score in identifying high risk atherosclerosis among patients with either RA, OA or FM. Equally if not more important in the present context, a far larger proportion of rheumatic disease patients is at high or very high CVD risk according to SCORE2 compared to the Framingham score. Framingham score underestimates the presence of high risk atherosclerosis more than SCORE2. Our results support the use of SCORE2 rather than the Framingham score in assessing CVD risk in both inflammatory and non-inflammatory rheumatic conditions.
REFERENCES: [1] Dessein P et al, J Rheumatol, 2016.
[2] SCORE2 working group and ESC Cardiovascular risk collaboration, Eur Heart J, 2021.
Performance of SCORE2 (AUC (95% CI)=0.78 (0.73-0.83)) compared to the Framingham score (AUC (95% CI)=0.74 (0.68-0.80)) (p value for difference=0.045) in identifying rheumatic disease patients with carotid or/and femoral artery plaque. SCORE=Systemic Coronary Risk Evaluation; AUC=area under the curve.
Differences in distribution of cardiovascular risk categories between Framingham score and SCORE2
| SCORE2 categories | ||||
|---|---|---|---|---|
| Low to
| High | Very high | ||
| 111 | 91 | 92 | ||
| Framingham categories | ||||
| Low | 232 | 110 | 74 | 48 |
| Moderate | 38 | 1 | 13 | 24 |
| High | 24 | 0 | 4 | 20 |
SCORE=Systemic Coronary Risk Evaluation
Acknowledgements: NIL.
Disclosure of Interests: None declared.
© The Authors 2025. This abstract is an open access article published in Annals of Rheumatic Diseases under the CC BY-NC-ND license (