fetching data ... 
Background: Anti-citrullinated protein antibodies (ACPAs) are a hallmark of rheumatoid arthritis (RA). However, due to scarcity of the antigen-specific B cell population, the transcriptome profile of ACPA-expressing B cells has not yet been revealed.
Objectives: We aimed to clarify transcriptomic features of ACPA-expressing B cells through single-cell RNA-seq.
Methods: We recruited ten clinically suspect arthralgia patients, ten untreated early RA patients, and ten established, methotrexate-treated RA patients. Peripheral blood (PB) ACPA-enriched B cells (ACPA+), tetanus toxoid (TT)-enriched B cells (TT+), and control antigen-negative ACPA- B cells were purified by flow cytometry using tetramer staining (Figure 1A). Additionally, ACPA-enriched and non-specific B cells were sorted from synovial fluid (SF) of two RA patients. Full-length Smart-seq2 single-cell RNA-seq was performed and transcriptome analysis was conducted using the Seurat pipeline with modifications. B cell receptor reconstruction and clonal analysis were performed using the BraCeR pipeline. Monoclonal antibodies were experimentally generated using the RATP-Ig method from fractions of ACPA+ and TT+ B cells and tested for specificity by ELISA.
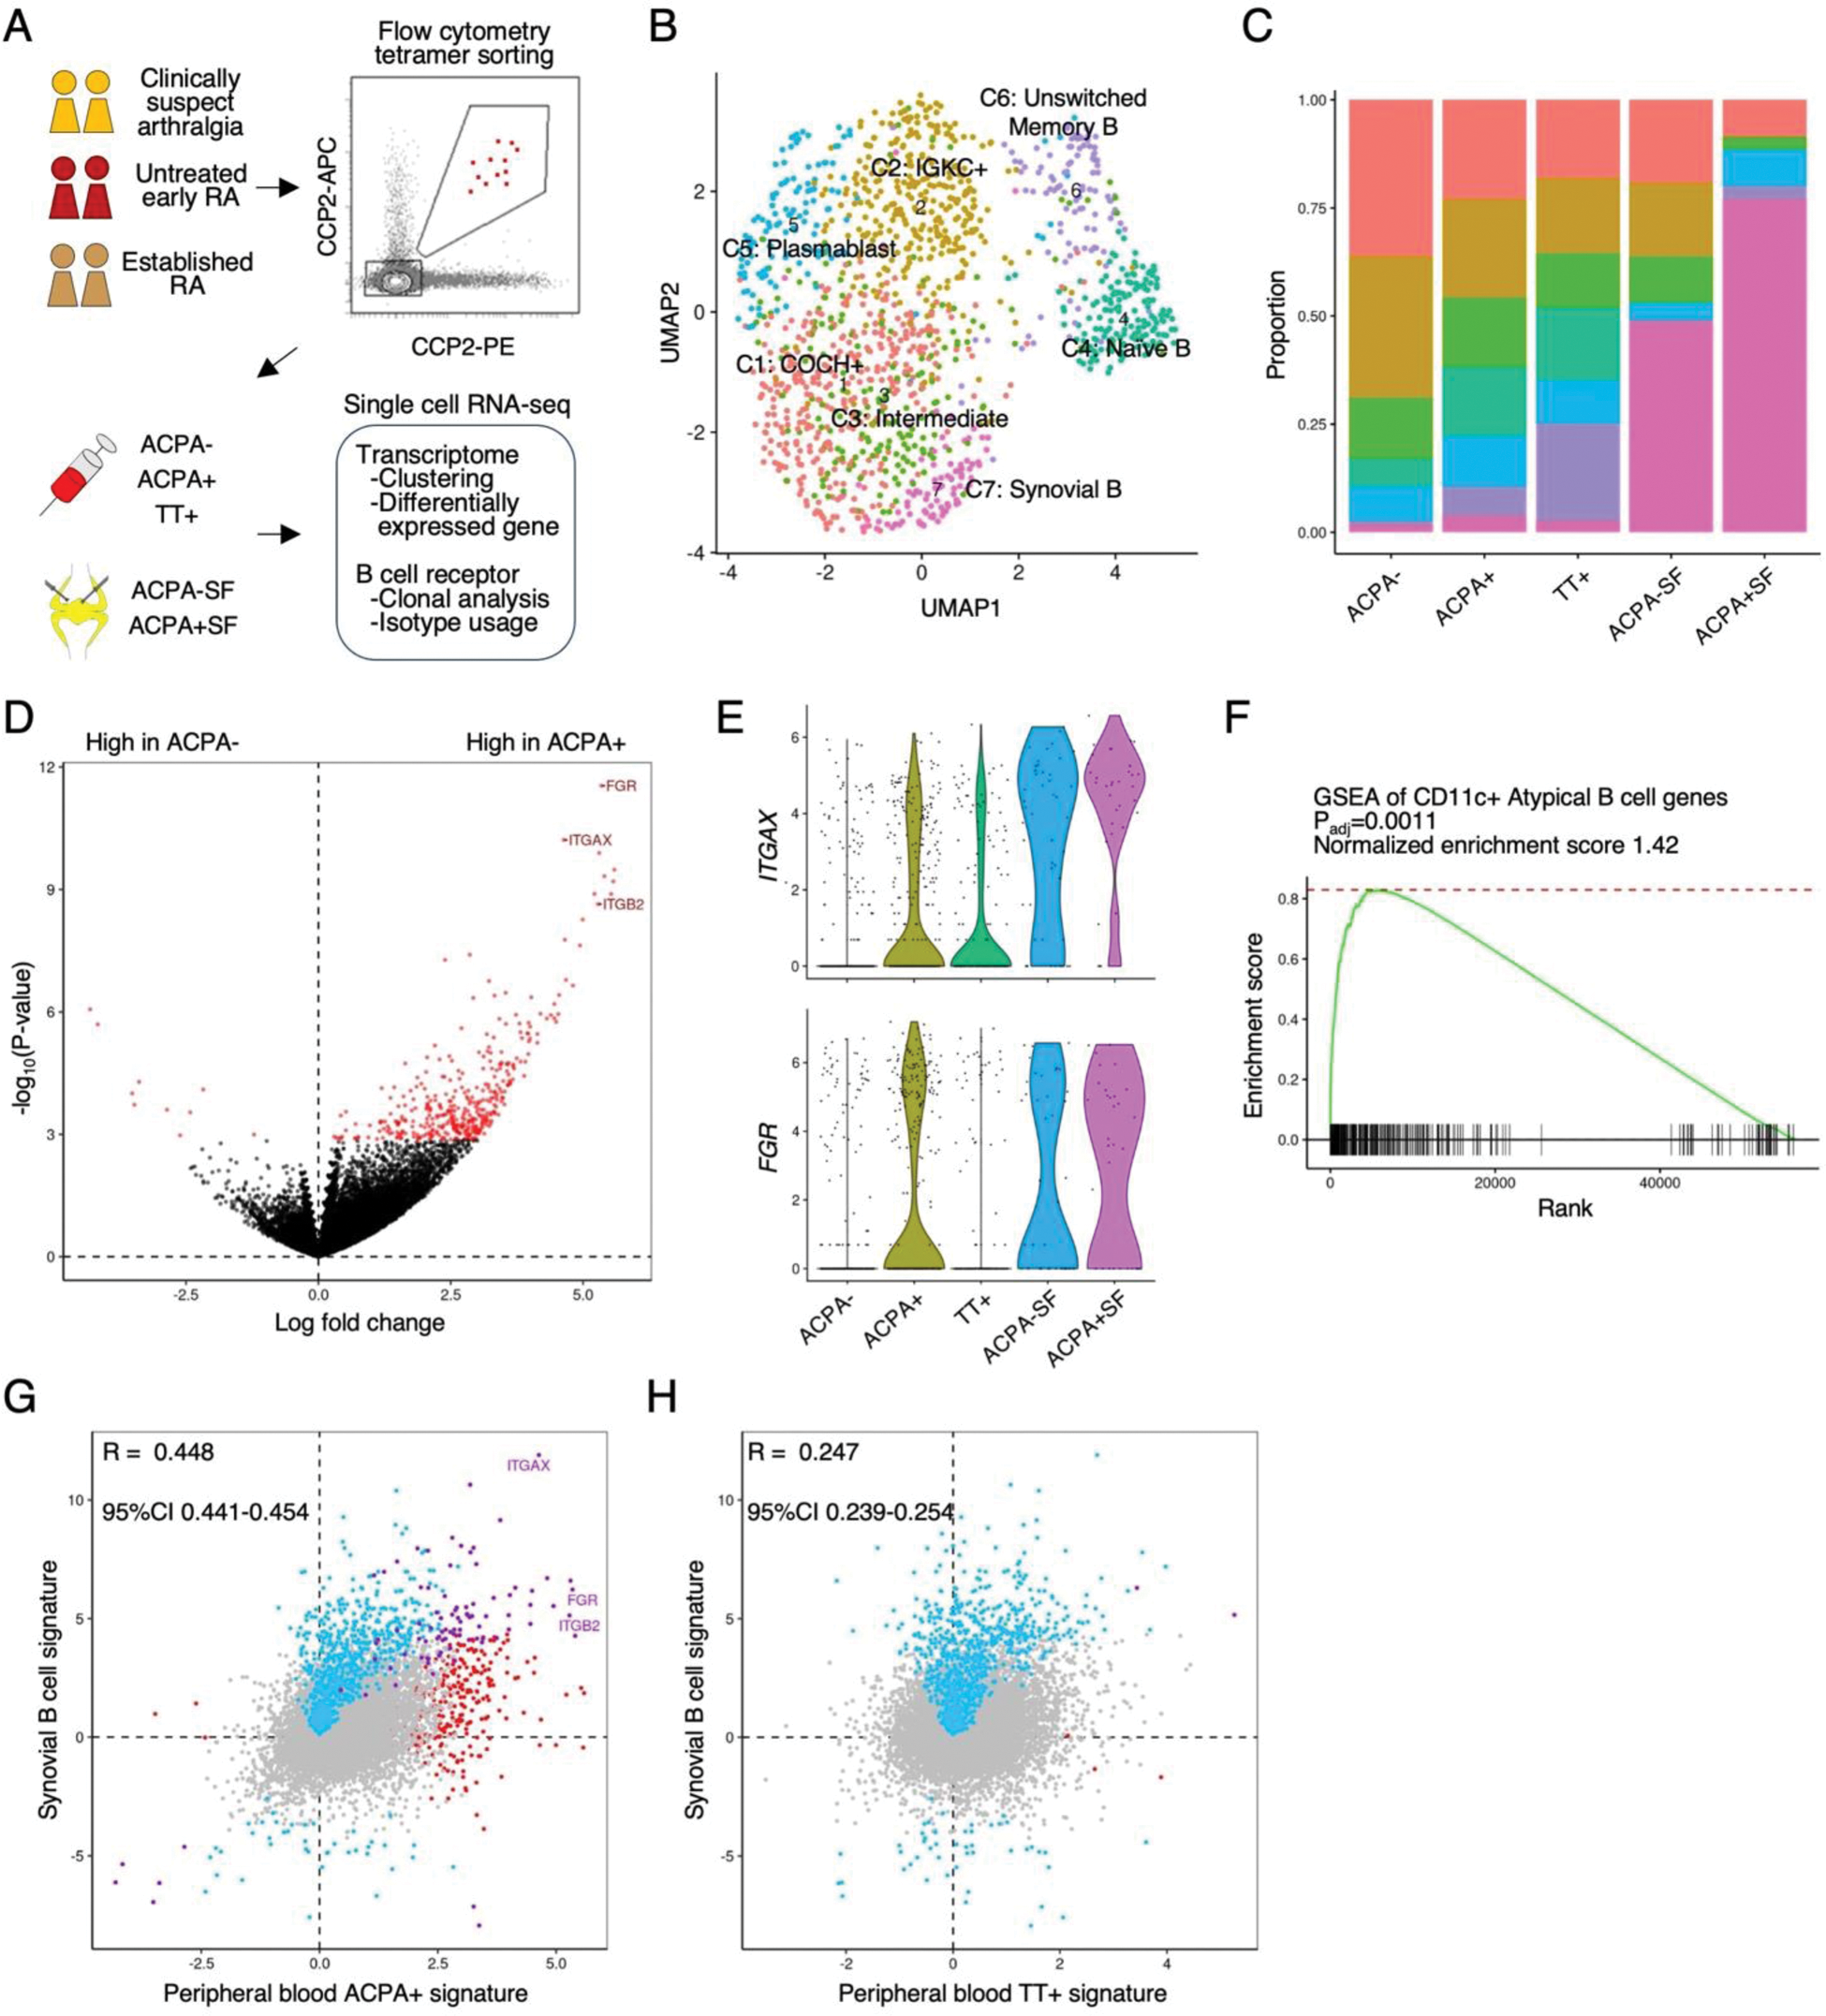
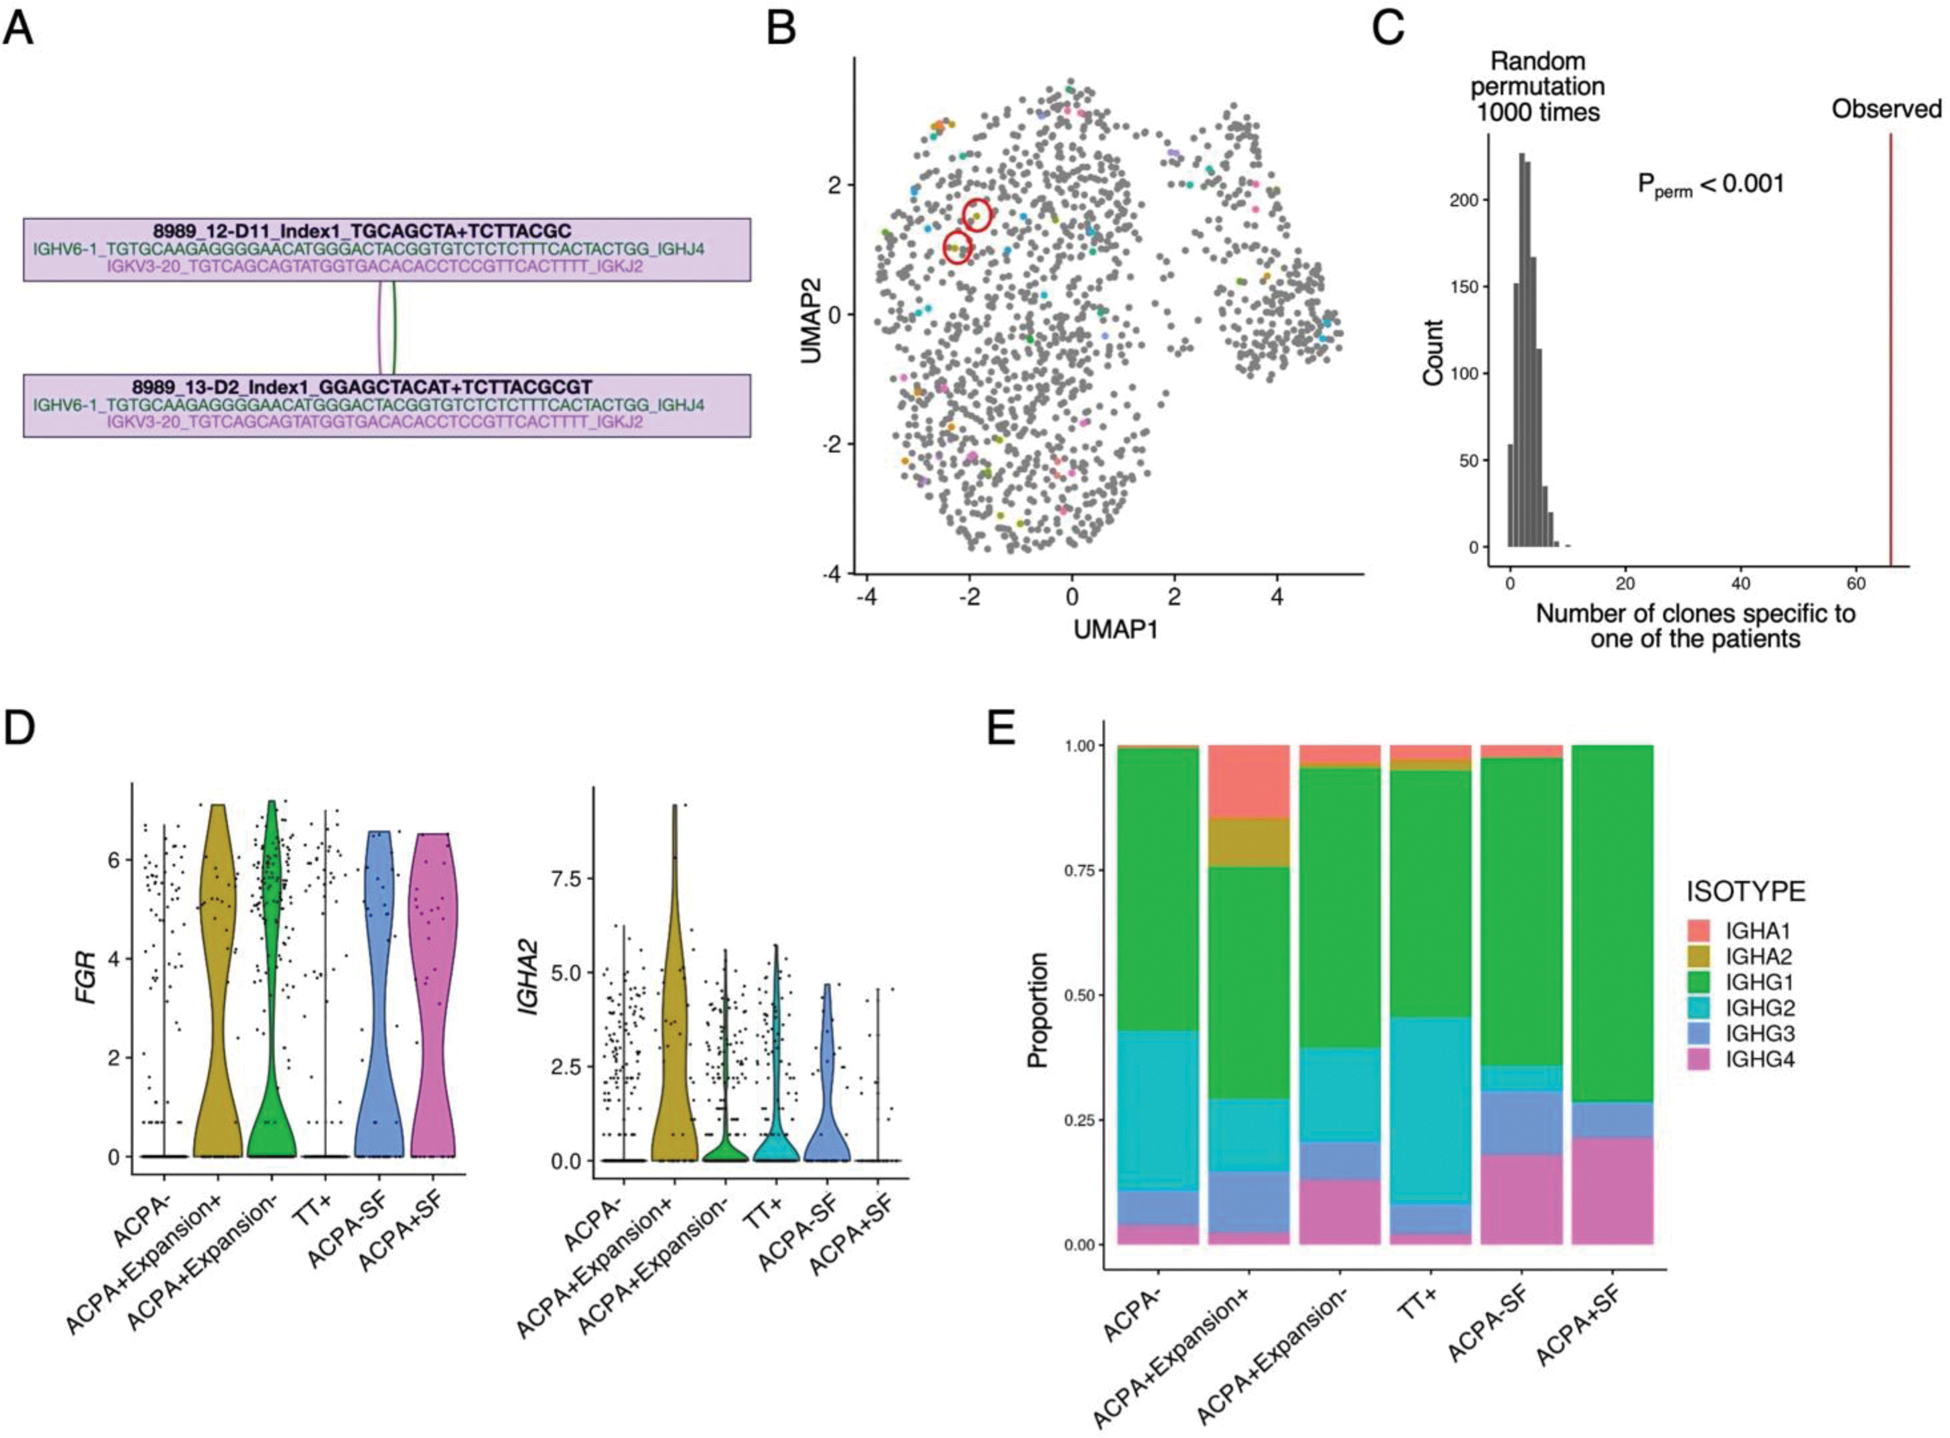
Results: After quality control based on transcriptome data, we obtained 494, 453, and 319 cells from the ACPA-, ACPA+, and TT+ PB B cell population, respectively. Likewise, 47 and 35 cells were present in the ACPA- and ACPA+ SF B cell population. Enrichment of ACPA+ and TT+ B cells in both respective populations was evidenced by the generation of monoclonal antibodies of sequenced B cell receptors. Unsupervised clustering analysis identified 7 B cell clusters (Figure 1B). The PB ACPA+ B cell population was heterogeneous, but most of the synovial ACPA+ B cell population was assigned to a single B cell cluster (C7, Figure 1C). The PB ACPA+ memory B cell population was characterized by high expression of CD11c+ atypical B cell genes such as ITGAX , FGR , and ITGB2 (Figures 1D-F) and exhibited similarity to the synovial B cell state (Figure 1G-H). Transcriptome differences of the ACPA+ B cell populations from different disease stages was small. B cell receptor clonal analysis identified expanded B cells sharing highly similar B cell receptor sequences (Figure 2A). These clonally “expanded” B cells were specific to either one of the patients (97%) or one of the specificities (e.g., ACPA+ or TT+, 90%) and clustered similarly in transcriptome analysis (65% in the same clusters), validating the quality of our dataset (Figure 2B-C). 13% of the B cells in the ACPA+ population exhibited clonal expansion. Expanded B cells in the ACPA+ population were characterized by high expression of FGR and a high usage of the IGHA isotype, potentially indicating a mucosal origin (Figures 2D-E).
Conclusion: PB ACPA-enriched B cell populations were characterized by a CD11c+ atypical B cell signature, indicating a role of CD11c+ atypical B cells in ACPA production. Further experimental validation is needed to confirm these findings.
CD11c+ atypical B cell gene signature in ACPA+ B cell population.
(A) Schematic overview of the study. (B) UMAP representation of B cells, with color codes representing 7 B cell clusters. (C) Proportions of B cell clusters in each cell specificity, using the same color code as in (B). (D) Differentially expressed gene (DEG) analysis comparing peripheral blood ACPA+ and ACPA- memory B cell populations. 394 significant genes are highlighted in red (FDR < 0.20). (E) Expression levels of ITGAX and FGR genes. (F) Gene set enrichment analysis (GSEA) of 307 CD11c+ atypical B cell genes in the peripheral blood ACPA+ B cell signature. (G-H) Comparison of the peripheral blood ACPA+ (vs ACPA-) B cell signature (G) or peripheral blood TT+ (vs ACPA-) B cell signature (H) with the synovial B (vs peripheral B) cell signature. Log fold changes from each DEG analysis are used. Red indicates significance in ACPA+ (or TT+) DEG analysis (FDR < 0.20), blue indicates significance in the synovial analysis, and violet indicates overlap in both analyses. Correlation between the signatures was tested with Pearson’s correlation test.
B cell receptor and multi-modal analysis of ACPA+ B cell population.
(A) Example of two clonal ACPA+ B cells sharing the identical B cell receptor (BCR) heavy and light chains. (B) Clonally expanded ACPA+ B cells projected onto the transcriptome embedding shown in Figure 1B. Each color represents a different expanded clone. The red circle highlights the example clone from (A). (C) Permutation test showing the empirical significance of BCR clonal overlap within individual patients. (D) Expression levels of FGR and IGHA2 genes. ACPA+ B cells are stratified by the presence of BCR clonal expansion. (E) Proportions of switched B cell isotype usage in each cell specificity.
REFERENCES: NIL.
Acknowledgements: This work was supported in part by a grant from Sanofi-Aventis Deutschland GmbH, as part of RTCure consortium, and SPIDERR-EU from Horizon Europe programme (grant 101080711).
Disclosure of Interests: Yasuo Nagafuchi: None declared, Linda Slot: None declared, Deimante Simaite D. Šimaite may hold shares and/or stock options in Sanofi, D. Šimaite is Sanofi employee, Aleida M. Bakker: None declared, Tommaso Andreani T. Andreani may hold shares and/or stock options in Sanofi, T. Andreani is Sanofi employee, Erik B. van den Akker: None declared, Tom Huizinga: None declared, Carsten Struebing C. Strübing may hold shares and/or stock options in Sanofi, C. Strübing is Sanofi employee, Rene E.M. Toes: None declared, Hans Ulrich Scherer: None declared.
© The Authors 2025. This abstract is an open access article published in Annals of Rheumatic Diseases under the CC BY-NC-ND license (