fetching data ... 
Background: Type I Interferon (IFN-I) and autoreactive B cells are crucial in SLE pathogenesis. Biologic therapies targeting these pathways (RTX, belimumab, and ANI) are already included in the current SLE treatment guidelines, but there is little evidence to guide when each should be chosen. Data on transcriptomic effects of each therapy individually have been published, but there have not been immunological comparison of different therapies in the same study, nor analysis at a functional protein level.
Objectives: To perform a longitudinal proteomic analysis of rituximab (RTX) or anifrolumab (ANI)-treated SLE patients.
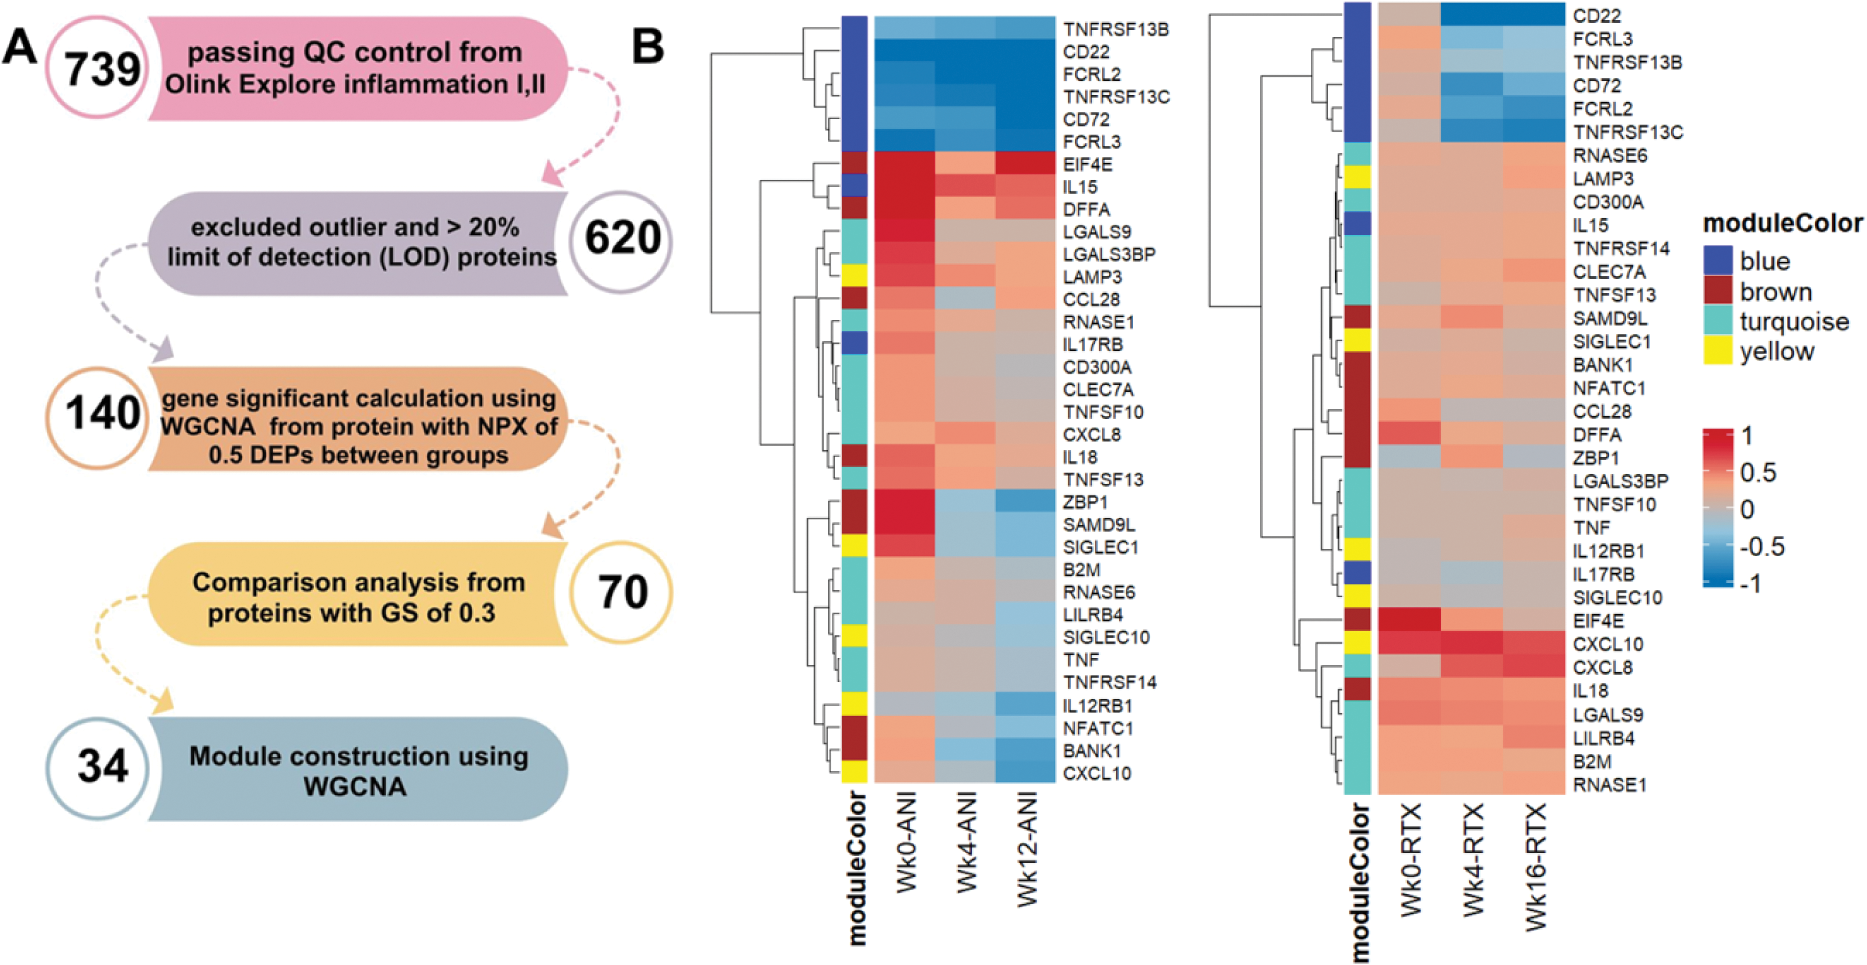
Methods: Patients with SLE (EULAR/ARC 2019 criteria) were treated as part of two previously published studies with RTX 2 x 100mg [1] or ANI 300mg monthly [2], in additional to stable background standard of care. Oral glucocorticoid doses were limited in accordance with study protocols. RTX-treated patients received 2 x 100mg methylprednisolone on days 1 and 14. Longitudinal serum samples at 0, 4 and 12-16 weeks were available from 22 RTX and 7 ANI patients. Samples were analysed using Proximity Extension Assay (PEA) proteomics with EXPLORE Inflammation I and II panels (Olink®, Uppsala, Sweden). Proteomic analyis workflow is demonstrated in Figure 1A. Protein data were analysed using the Weighted Gene Co-expression Network Analysis (WGCNA) using R package version 4.3.1 to define modules of co-clustered proteins. Gene (proteins)-significant (GS) value and WGCNA-modules of proteins were tested for correlations with clinical traits using Pearson correlation. Protein quantification between treatment time points was compared using the paired-T test (p-value < 0.05 considered significant).
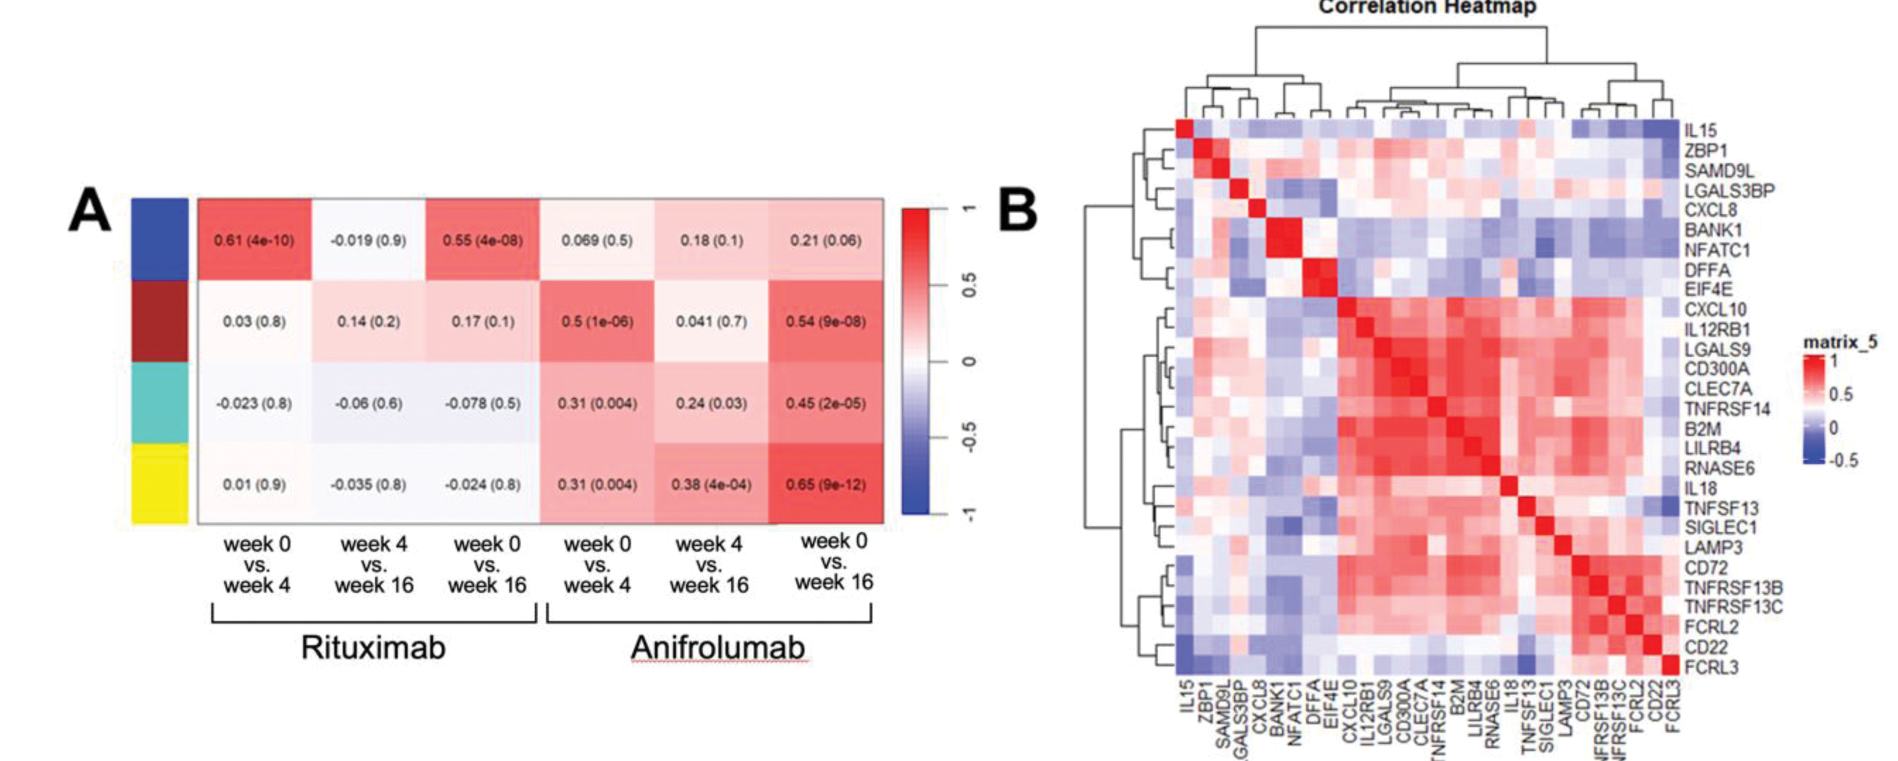
Results: The GS value was calculated from 140 differentially expressed proteins (DEPs), defined by ≥0.5 fold, p<0.05 difference between timepoints within each therapy analysed using WGCNA. Proteins with a GS greater than 0.3, compared between treatment time points are shown in Figure 1B. 34 proteins were used to construct four representative protein modules. Module-trait correlations are shown in Figure 2A with positive correlations denoting proteins with a reduced level after treatment. Blue module proteins (B cell related) significantly reduced at both 4 and 16 weeks after with RTX treatment while not impacted by ANI. The other three modules (including ISG-encoded and other proteins) were modulated by ANI; proteins in brown module declined earlier, while those in yellow and turquoise modules later. Analysing post-treatment samples we assessed correlation between proteins to identify treatment-resistant signatures (Figure 2B). These demonstrated three subgroups based on protein function. The first group included CD22, CD72, TNFRSF13B, TNFRSF13C, FCRL2, and FCRL3, associated with B cell function. The second group included ZBP1, CXCL10, SAMD9L, SIGLEC1; these correlated with IFN signalling. The third group included proteins involved in neutrophil activation (IL15, IL18, CXCL8, and LAMP3); these proteins did not respond to biologic drugs (Figures 1B, 2C).
Conclusion: Although the B cell and IFN-I pathways targeted by licensed biologics are inter-linked, here we identify differences between the biological effects of these therapies at a protein level. Notably, rituximab has a marked early effect on B cell-related proteins but more limited effects on other immune aberations. In contrast, with anifrolumab we see earlier and later-phase responses at a protein level. Lastly, our data suggest protein signatures representing resistant disease including those not responsive to either therapy evaluated. These findings suggest the potential to match targeted therapies to resistant disease mechanisms on an individual patient basis.
REFERENCES: [1] ARD 2023;82:202
[2] PMID: 36944572
(A) Proteomic study workflow. (B) Heatmap demonstrating NPX level between three treatment time points.
(A) Module trait correlation for treatment time points in anifrolumab and rituximab-treated SLE patients; positive correlations denote protein reduction after treatment. (B) Correlation heatmap of the selected biomarkers.
Acknowledgements: NIL.
Disclosure of Interests: Porntip Intapiboon: None declared, Lucy M Carter: None declared, Jack Arnold: None declared, Khaled Mahmoud: None declared, Md Yuzaiful Md Yusof Alumis, Roche and Novartis, Aurinia Pharmaceuticals and UCB, Edward M. Vital Roche, GSK, AstraZeneca, Aurinia Pharmaceuticals, Lilly and Novartis, Roche, AstraZeneca and Sandoz.
© The Authors 2025. This abstract is an open access article published in Annals of Rheumatic Diseases under the CC BY-NC-ND license (