fetching data ... 
Background: In rheumatoid arthritis (RA), fibroblast-like synoviocytes (FLS) acquire an aggressive phenotype and alter their metabolism to support their activation.
Objectives: Here, we aimed to analyse the full spectrum of metabolic alterations in RA FLS vs. non-inflamed (NI) FLS by performing untargeted metabolomic.
Methods: Untargeted annotated metabolomics was performed using liquid chromatography coupled to quadrupole time-of-flight mass spectrometry in established cell cultures of RA and NI FLS, as well as in serum samples from patients with early RA collected before and after treatment. Primary RA and NI FLS were collected respectively from 10 patients with RA undergoing joint replacement surgery and 7 patients without previous history of arthritis, undergoing diagnostic arthroscopy due to previous injury that occurred over 2 months prior to the operation (Figure 1A). In NI and RA FLS, western blot was used to compare the protein expression of carnitine-related transporters and enzymes, and Seahorse Real-Time Cell Metabolic Analysis was used to determine the metabolic functions. Serum samples at baseline and 24-week follow-up were obtained from a subset of 220 participants who were randomly selected from the Swedish arm (n=393) of the NORD-STAR study (Figure 2A) [2, 3]. Remission was defined as clinical disease activity index (CDAI) remission (CDAI≤ 2.8) at the 24-week follow-up.
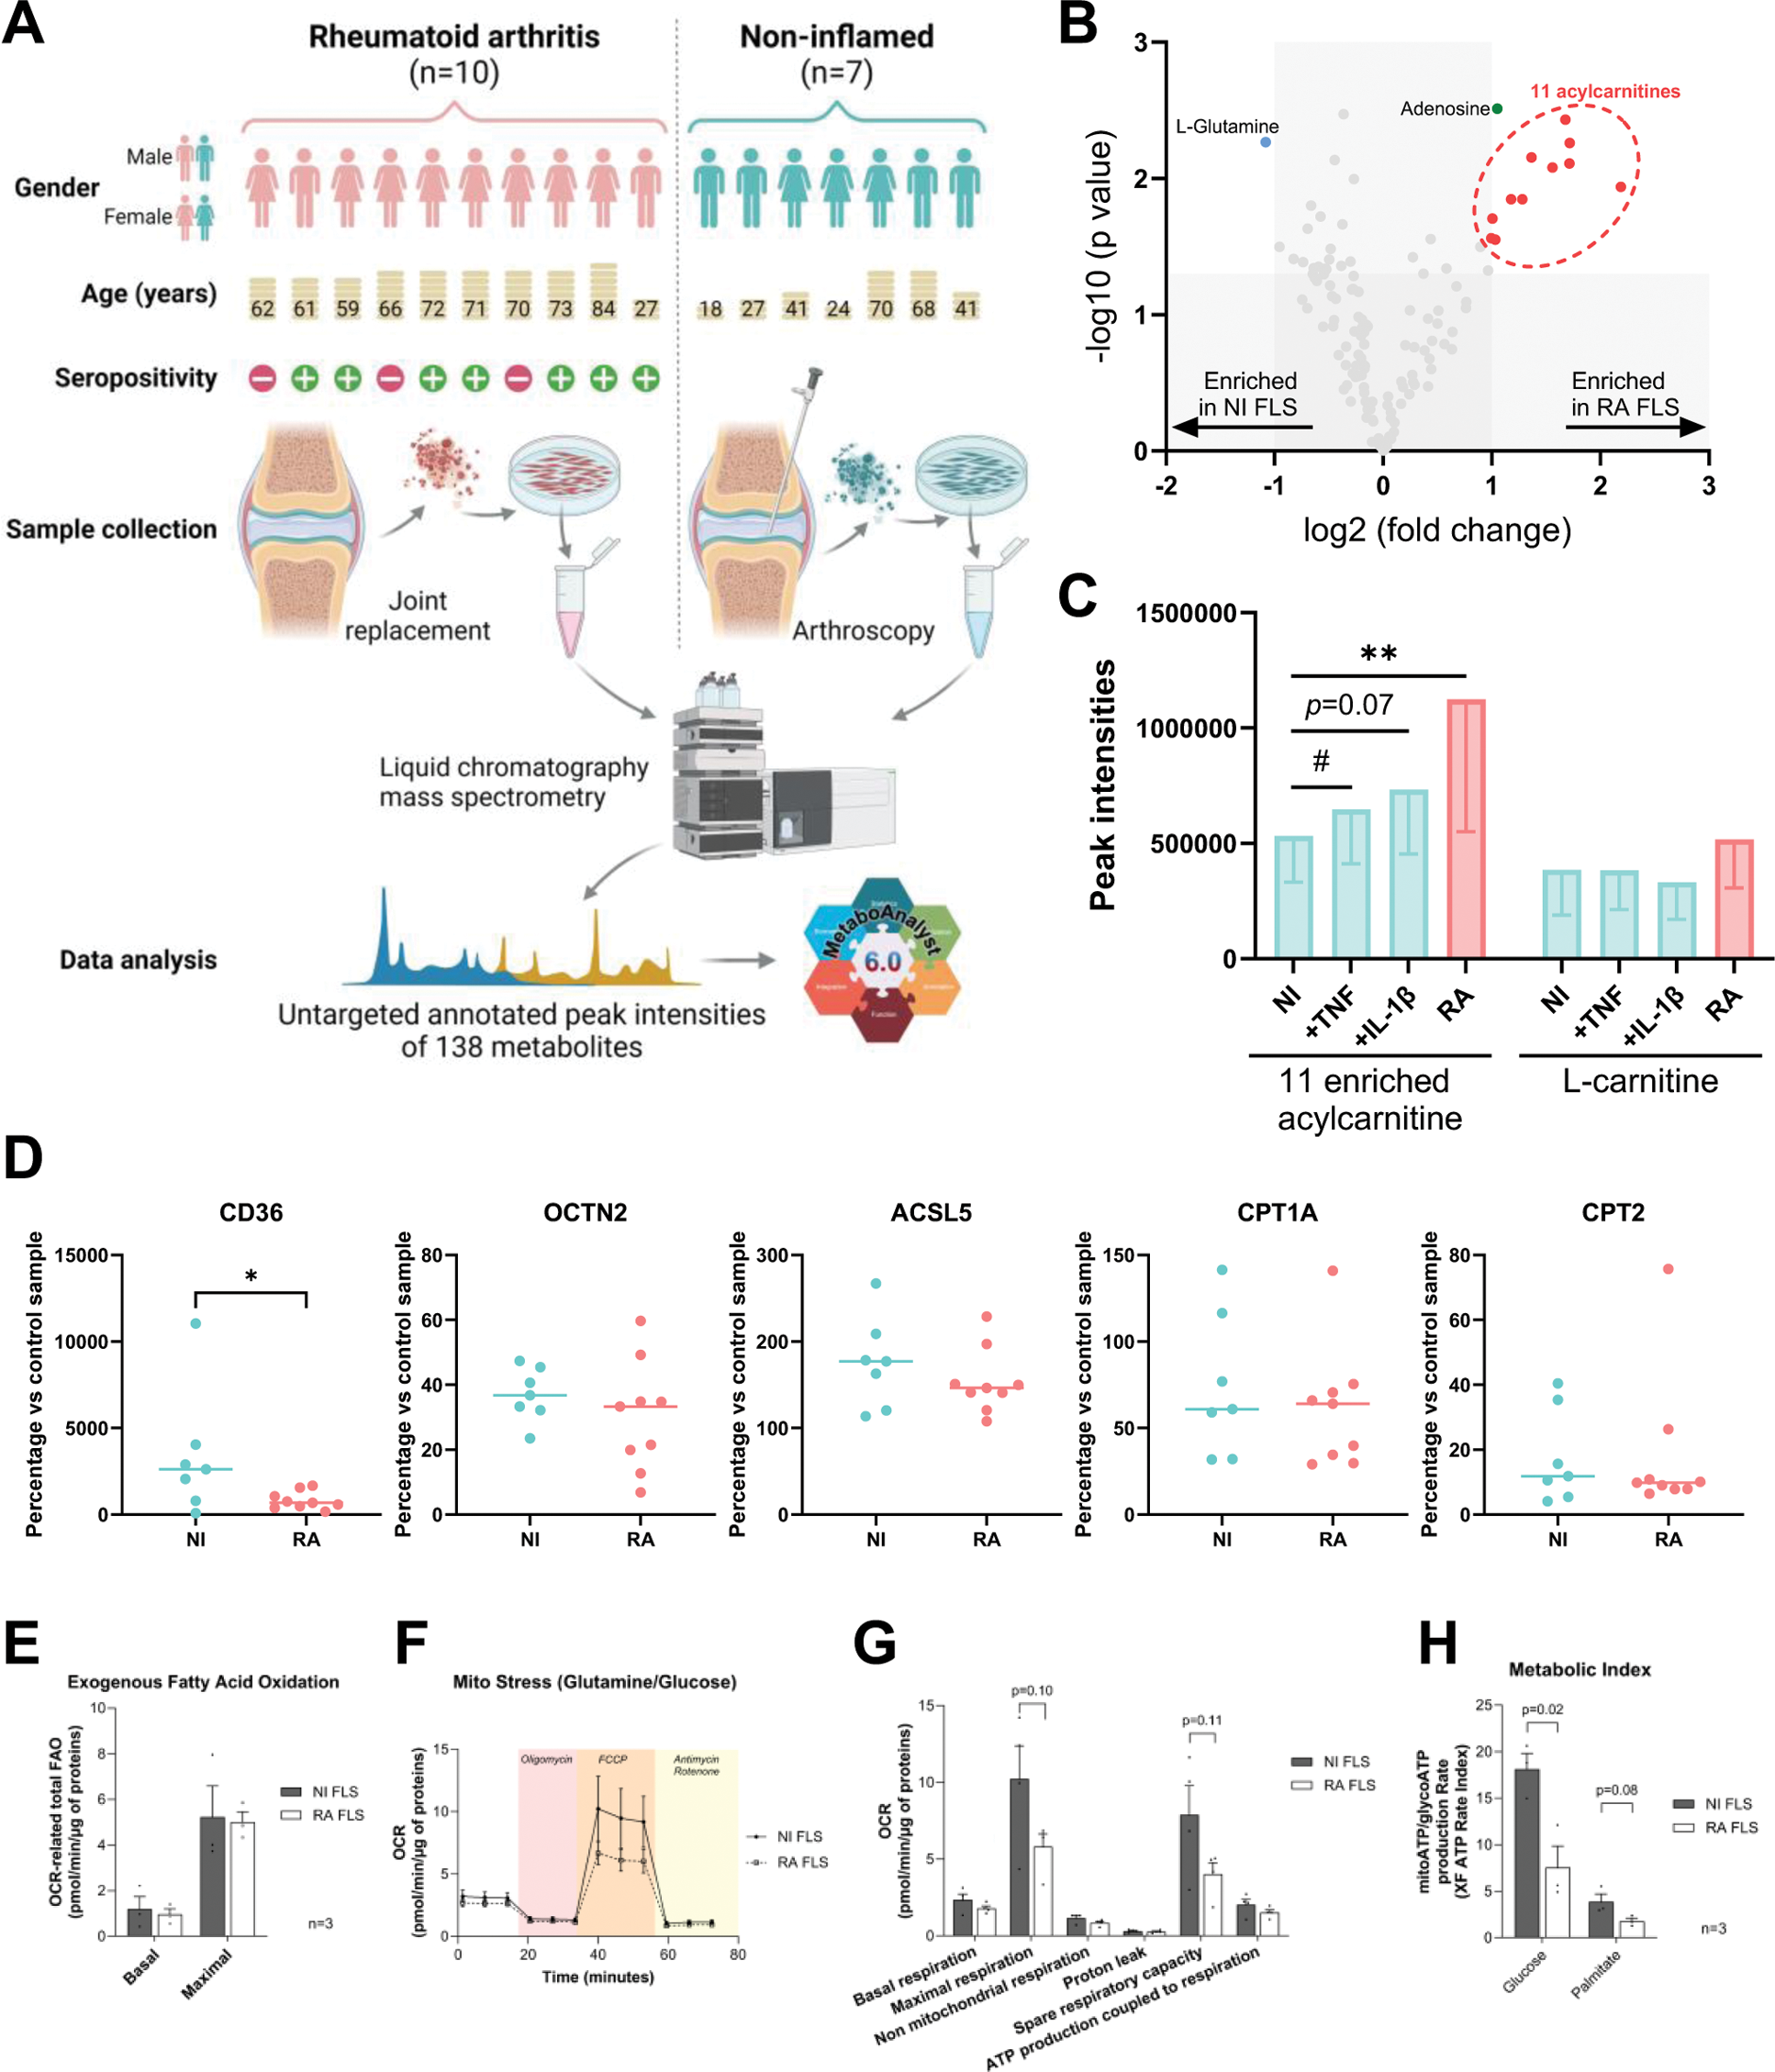
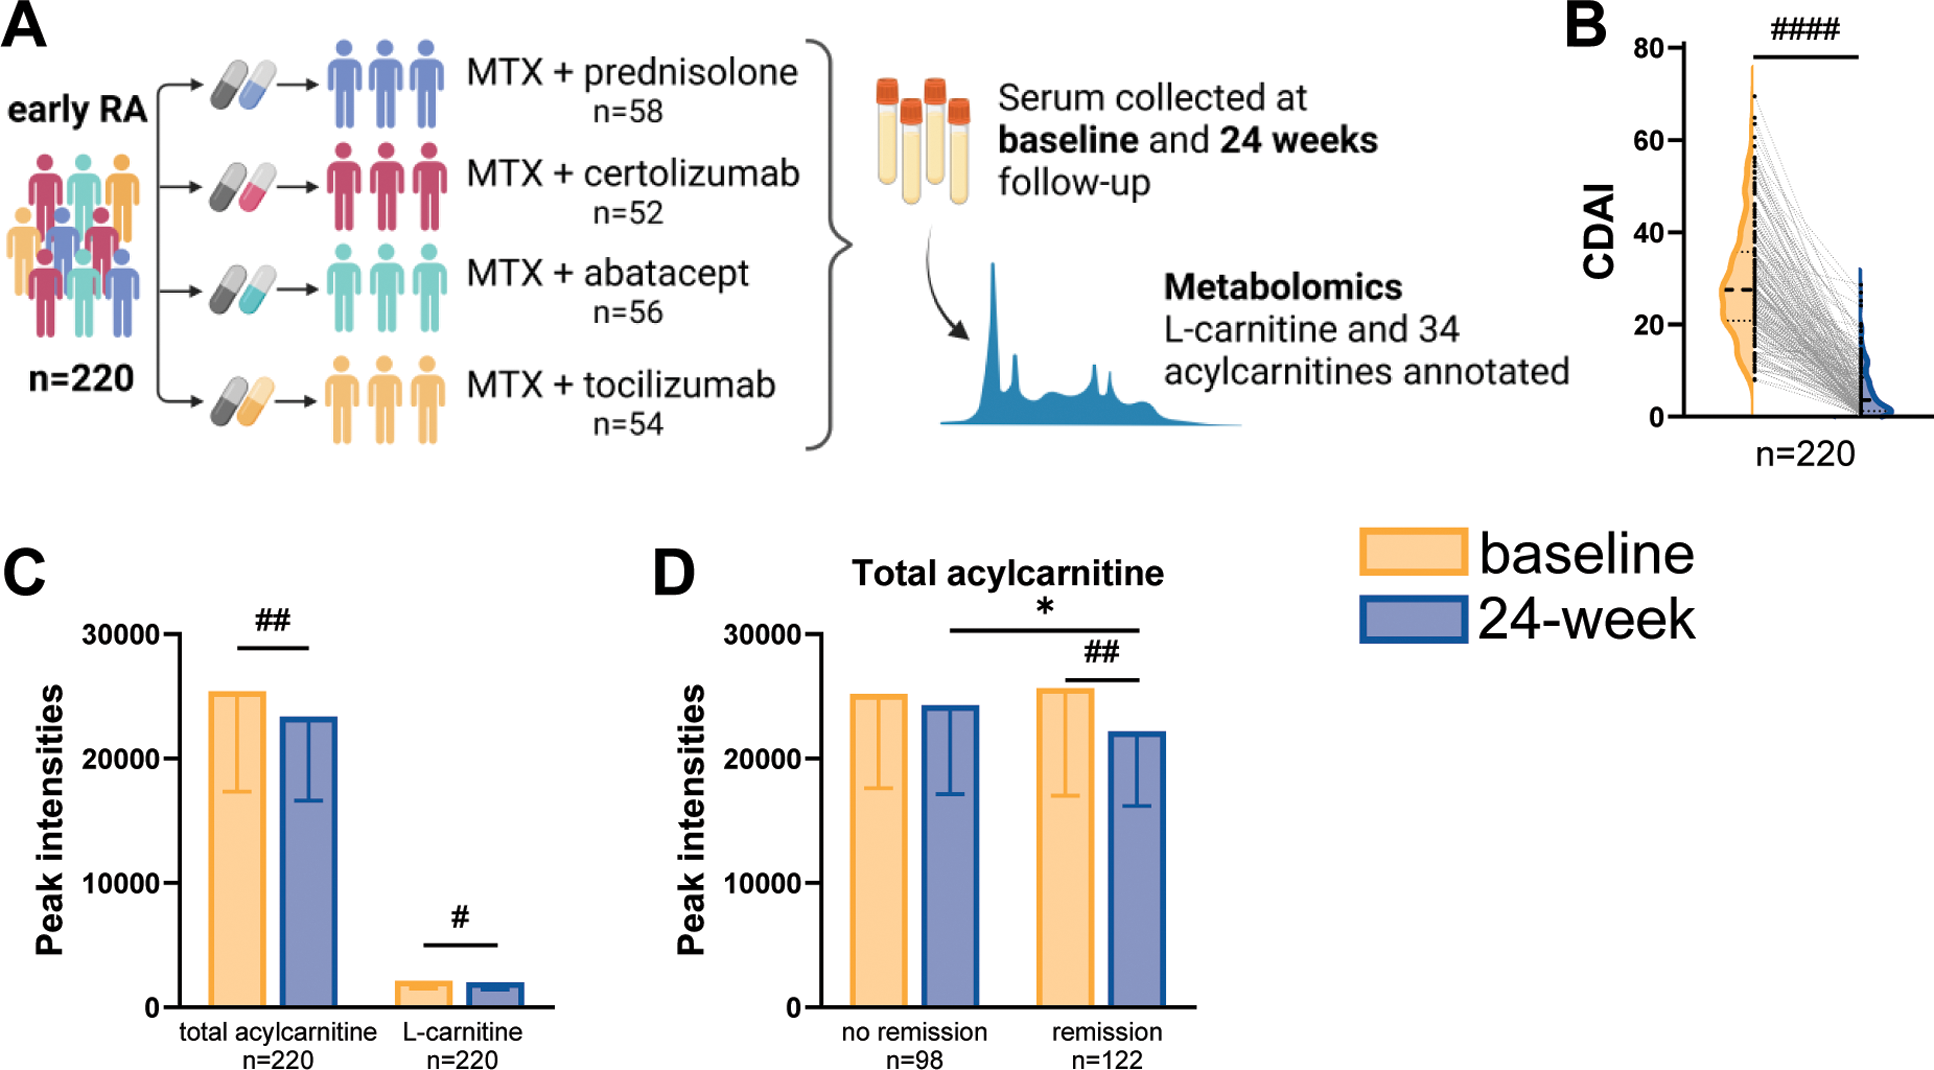
Results: Metabolomics analysis based on 138 annotated metabolites revealed a distinct metabolic fingerprint between RA and NI FLS. Out of 12 metabolites enriched in RA FLS vs. NI FLS, 11 were acylcarnitines (Figure 1B). Pro-inflammatory stimulation of NI FLS by tumor necrosis factor (TNF) or interleukin-1β (IL-1β) also elicited an increase in acylcarnitines (Figure 1C). Levels of L-carnitine, the free form of carnitine, did not change between NI FLS, NI FLS with stimulation, and RA FLS. Expression of fatty acid transporter CD36 was higher in NI FLS than RA FLS, whereas the expressions of other carnitine-related transporters and enzymes were similar in NI and RA FLS (Figure 1D). Seahorse analysis showed no difference in fatty acid oxidation (FAO) between RA and NI FLS (Figure 1E); however, RA FLS displayed mitochondrial dysfunction and energetic impairment as shown in Figures F to H. To determine if acylcarnitine metabolism is systemically affected in RA, we analysed the metabolomics data of L-carnitine and 34 detected acylcarnitines in serum samples from 220 patients with early RA (Figure 2A). After 24 weeks of treatment, a significant decrease of CDAI was observed and 98 patients achieved CDAI remission (Figure 2B). The total acylcarnitine content significantly decreases after 24 weeks of treatment (Figure 2C), and this reduction is only observed in patients who achieved CDAI remission (Figure 2D).
Conclusion: We identified a distinct metabolic profile in RA FLS, characterised by enrichment in acylcarnitines, which was inducible in NI FLS after pro-inflammatory stimulation. Despite elevated acylcarnitine levels, RA FLS did not exhibit an increase in mitochondrial FAO but showed energetic impairment linked to mitochondrial dysfunction. Finally, blood acylcarnitine content in patients with early RA was reduced following successful treatment.
Metabolomics analysis in FLS. A. Experimental set up overview. B. Enriched metabolites by volcano plot defined as fold change (x) ≥1.5 and Mann-Whitney test p-value (y) <0.05. C. Content of the 11 acylcarnitine enriched in RA FLS and L-carnitine in NI FLS, NI FLS stimulated with TNF and IL-1β, and RA FLS presented as mean ± standard deviation. D. Expression levels of CD36 (fatty acid transporter), OCTN2 (L-carnitine transporter), ACSL5 (acyl-CoA Synthetase Long Chain Family Member 5), CPT1A (carnitine Palmitoyltransferase 1A; enzyme converting acylcarnitines), and CPT2 (enzyme de-conjugates acylcarnitines) were measured by western blot. Seahorse analyses were performed to determine E. FAO; F-G. mitochondrial function; and H. metabolic index. Significance was determined by Wilcoxon test (#) or Mann-Whitney test (*) in C, Mann-Whitney test (*) in D, and unpaired t-test in E to H (*).
Metabolomics analysis in serum from patients with early RA. A. Cohort description. B. CDAI at baseline and 24 weeks after treatment shown as half violin plot. C. Changes of acylcarnitine content (34 annotated acylcarnitines) and L-carnitine at baseline and 24 weeks after treatment. D. Changes of acylcarnitine content in patients who did or did not achieve CDAI remission after 24 weeks of treatment. Data in C and D were presented as mean ± standard deviation. Significance was determined by paired (#) or unpaired (*) t-test.
REFERENCES: [1] Vasileiadis GK, et al. Annals of the Rheumatic Diseases (Scientific Abstracts). 2024;83:741.
[2] Hetland ML, et al. BMJ (Clinical research ed). 2020;371:m4328.
[3] Fatima T, et al. Annals of the Rheumatic Diseases (Scientific Abstracts). 2024;83:739-740.
Acknowledgements: Swedish Metabolomics Centre, Umeå, Sweden is acknowledged for metabolic profiling by LC-MS. We thank all the patients, investigators, nurses, assessors, and teams involved in the included studies.
Disclosure of Interests: Georgios K. Vasileiadis: None declared, Yuan Zhang: None declared, Marion Laudette: None declared, Tahzeeb Fatima: None declared, Anna-Karin H Ekwall Boehringer Ingelheim, AbbVie and Pfizer, Aqilion, Reshmi Sureshkumar: None declared, Ronald F. van Vollenhoven AbbVie, AstraZeneca, Biogen, BMS, Galapagos, GSK, Janssen, Pfizer, RemeGen, and UCB, AbbVie, AstraZeneca, Biogen, BMS, Galapagos, GSK, Janssen, Pfizer, RemeGen, and UCB, Alfasigma, AstraZeneca, BMS, Galapagos, MSD, Novartis, Pfizer, Roche, Sanofi, and UCB, Jon Lampa: None declared, Bjorn Gudbjornsson Novartis and Nordic Pharma, Novartis, Espen A Haavardsholm Pfizer, UCB, and AbbVie, Dan Nordström BMS, Lilly, MSD, Novartis, Pfizer, and UCB, MSD, Gerdur Grondal: None declared, Kim Hørslev-Petersen: None declared, Kristina Lend: None declared, Merete Lund Hetland Pfizer, Medac, Sandoz, Novartis, and UCB, AbbVie, BMS, Eli Lilly, MSD, Pfizer, Sandoz, Novartis, Nordforsk, and UCB, Michael Nurmohamed: None declared, Mikkel Østergaard: None declared, Till Uhlig Galapagos, Lilly, Pfizer, and UCB, Tuulikki Sokka-Isler Abbvie, Lipum, Pfizer, Nordic Medicine, and UCB, Amgen and Nordic Medicine, Anna Rudin: None declared, Jon Borén: None declared, Monica Guma Regeneron, Sonoma, Cristina Maglio: None declared.
© The Authors 2025. This abstract is an open access article published in Annals of Rheumatic Diseases under the CC BY-NC-ND license (