fetching data ... 
Background: Therapy response metrics in rheumatoid arthritis (RA) continue to be developed and refined due to the seemingly unavoidable subjectivity of both patient reported outcomes (PROs) and evaluator reported outcomes (EROs) both in randomized controlled trials (RCTs) as well as real-world trials [1-4].
Objectives: This study aimed to identify the most effective clinical outcomes for assessing therapy response in RA using a data-driven approach.
Methods: Leveraging a cohort of RA patients treated with TNFi, T-cell and IL-6 inhibitors, the methodology investigated 24-week percentage changes from baseline for traditional key clinical measurements. These clinical measurements included provider-assessed tender joint count (TJC) and swollen joint count (SJC), c-reactive protein, and patient-reported outcomes such as patient pain and global assessments. An unsupervised machine learning clustering algorithm was applied to identify naturally distinct response status groups using various combinations of these measurements. Silhouette scores, which measure inter- and intra-cluster distances, were employed to rank clustering performance, providing a quantitative basis for identifying response patterns [5].
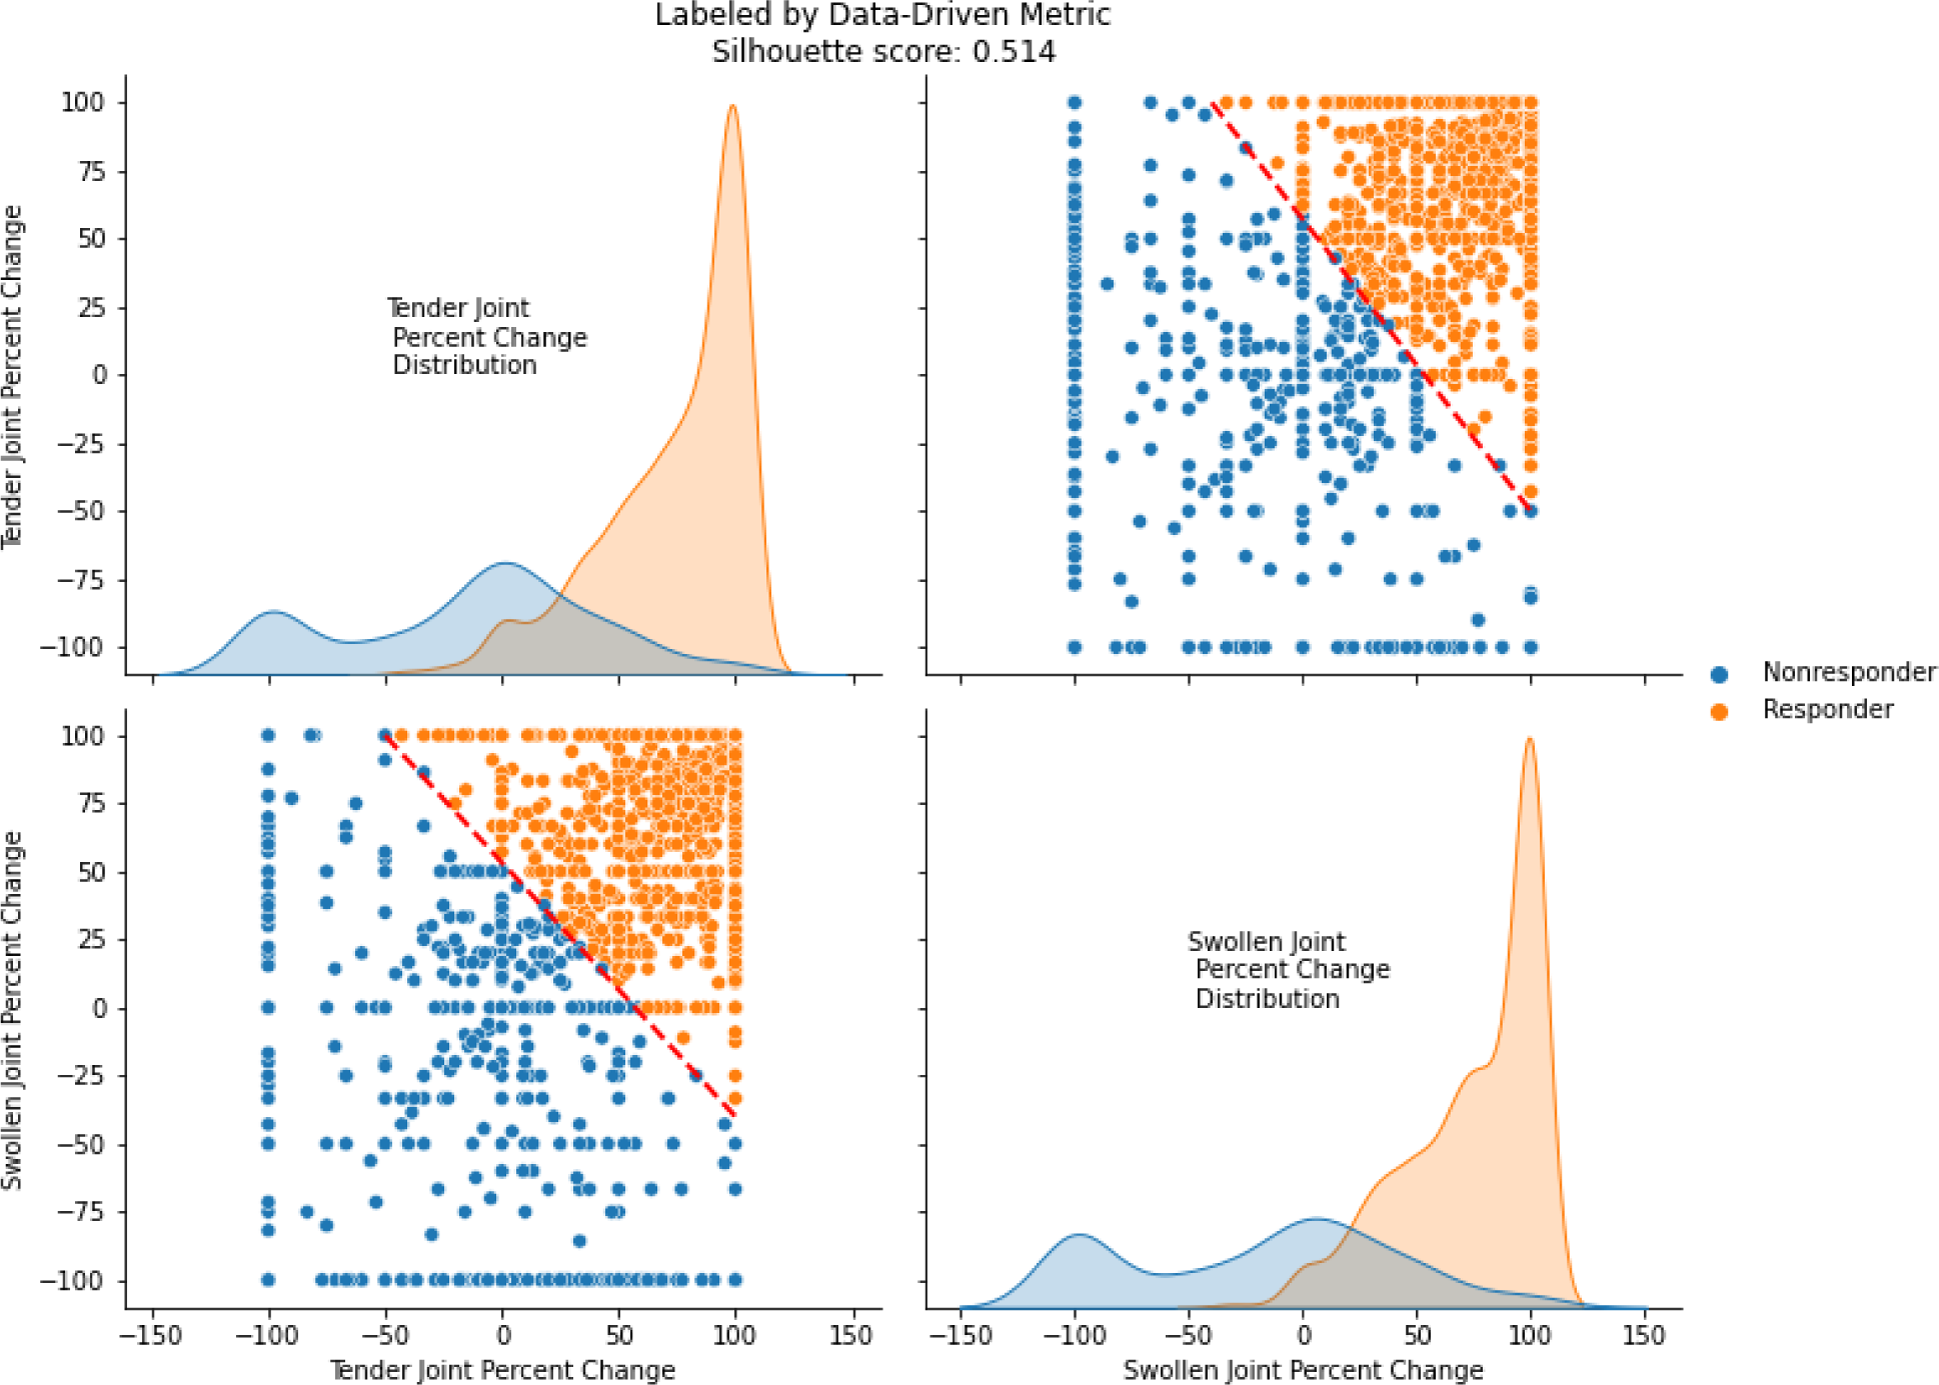
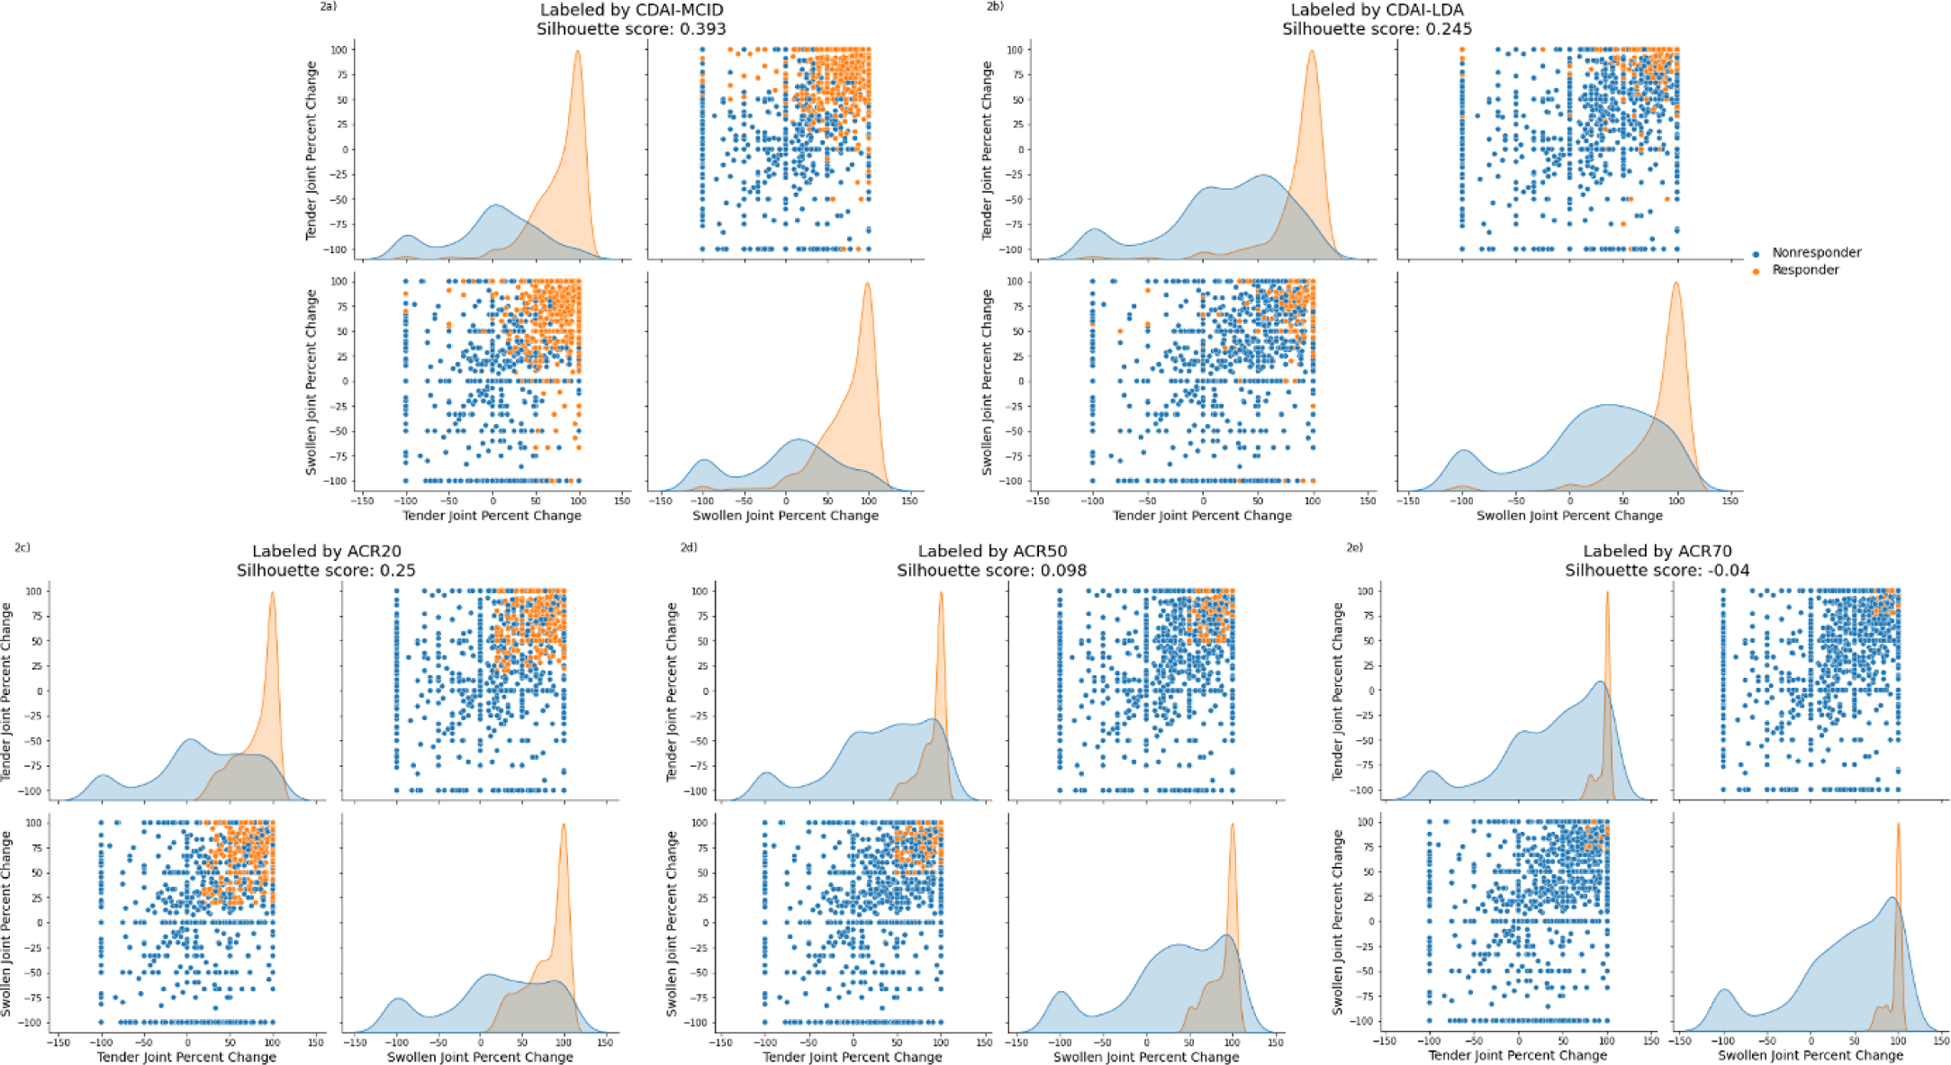
Results : A total of 1,497 patients contributed to the analysis, with 803 on TNFi, 382 on T-cell inhibitors, and 312 on IL-6 inhibitors. Results demonstrated that combining percentage changes in TJC and SJC provided the most robust metric for therapy response assessment. A decision boundary of 0.6 × (TJC percent change) + 0.8 × (SJC percent change)- 40 was identified as optimal by its higher silhouette score, and the higher coefficient for SJC in the boundary equation highlights its stronger role in therapy response. Values exceeding this threshold of 0 were indicative of a positive therapy response (see Figure 1). The joint scatterplot of TJC and SJC shows separation of response status for this data-driven metric, as supported by the minimal overlap in the individual univariate distribution plots and a silhouette score of 0.514. Furthermore, it demonstrated its superior performance in distinguishing response statuses when compared to existing clinical response labels such as CDAI and ACR metrics (see Figure 2).
Conclusion: This approach offers a novel refined framework for evaluating RA therapy efficacy, supporting personalized treatment strategies. This may also bridge the barrier between findings in RCTs and those from real-world data harmonizing PROs and EROs.
illustrates the distribution and clustering of RA patients based on percentage changes at 24 weeks from baseline in tender joint count (TJC) and swollen joint count (SJC). The upper-right and lower-left subplot depict the scatterplot of TJC versus SJC, overlaid with the decision boundary (red dashed line), which separates the clusters based on the optimized metric. The upper-left and lower-right subplots display the univariate distributions of percentage changes in TJC and SJC individually for each cluster, highlighting distinct response categories. All subplots are colored into responder (orange) and non-responder (blue).
demonstrates separation and overlap from clusters formed by CDAI-MCID, CDAI-LDA (at the top) andACR20, ACR50, and ACR70 metrics (at the bottom) for TJC and SJC. Each panel represents a method, with subplots displaying scatterplots and density distributions for responders (orange) and non-responders (blue), defined by the corresponding metrics. The distribution of response status varies significantly across metrics, with CDAI-MCID achieving relatively higher silhouette scores compared to other traditional metrics, coming closer to the silhouette score achieved by the data-driven joint count metric.
REFERENCES: [1] Guyatt G, Oxman AD, Akl EA, et al. GRADE guidelines: 1. Introduction-GRADE evidence profiles and summary of findings tables. J Clin Epidemiol. 2011;64(4):383–94.
[2] Monti S, Grosso V, Todoerti M, Caporali R. Randomized controlled trials and real-world data: differences and similarities to untangle literature data. Rheumatology (Oxford). 2018;57(57 Suppl 7):vii54–8.
[3] Rothwell PM. External validity of randomized controlled trials: ‘‘To whom do the results of this trial apply?’’ Lancet. 2005;365(9453):82–93.
[4] Blonde L, Khunti K, Harris SB, Meizinger C, Skolnik NS. Interpretation and impact of real-world clinical data for the practicing clinician. Adv Ther. 2018;35(11):1763–74.
[5] Rousseeuw, P. J. (1987). Silhouettes: A graphical aid to the interpretation and validation of cluster analysis. Journal of Computational and Applied Mathematics, 20, 53–65.
Acknowledgements: NIL.
Disclosure of Interests: Angus Wong Scipher Medicine, Sherry Guardiano Scipher Medicine, Viatcheslav Akmaev Scipher Medicine, Lixia Zhang Scipher Medicine.
© The Authors 2025. This abstract is an open access article published in Annals of Rheumatic Diseases under the CC BY-NC-ND license (