fetching data ... 
Background: In SLE, specific B cell subtypes are expanded, including those that may reflect extrafollicular B cell pathway, and are thought to harbour autoreactive clones. The exact phenotype of these autoreactive B cells is still not fully elucidated, but impaired expression of checkpoint inhibitor molecules on B cells has been hypothesized to associate with the development of autoreactivity in SLE.
Objectives: To investigate the expression of CD72, an immune checkpoint molecule, on expanded extrafollicular B cell subsets, its association with disease manifestations, and its possible dynamic changes upon treatment in SLE patients.
Methods: Twenty-five SLE patients with either inactive (n = 5; SLEDAI-2K score < 4) or active disease (n = 20; SLEDAI-2K score ≥ 4) and ten healthy controls were evaluated. Seven of twenty active SLE received rituximab (RTX) (lupus nephritis, n= 3) and were sampled at baseline, 3, and 6 months. PBMCs were analyzed by spectral flow cytometry with a 26-fluorochrome antibody panel, including CD72 for B cell phenotyping. Cell phenotypes were assessed in relation with markers of disease activity.
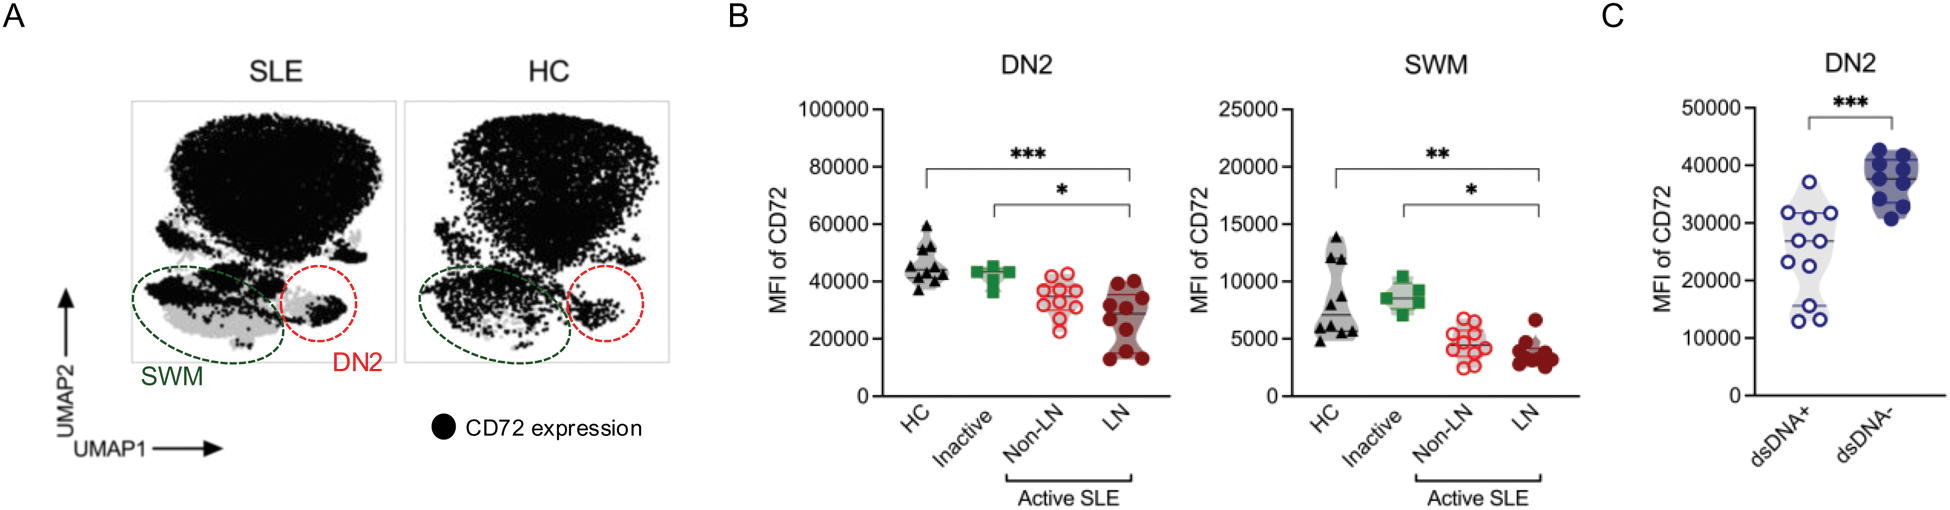
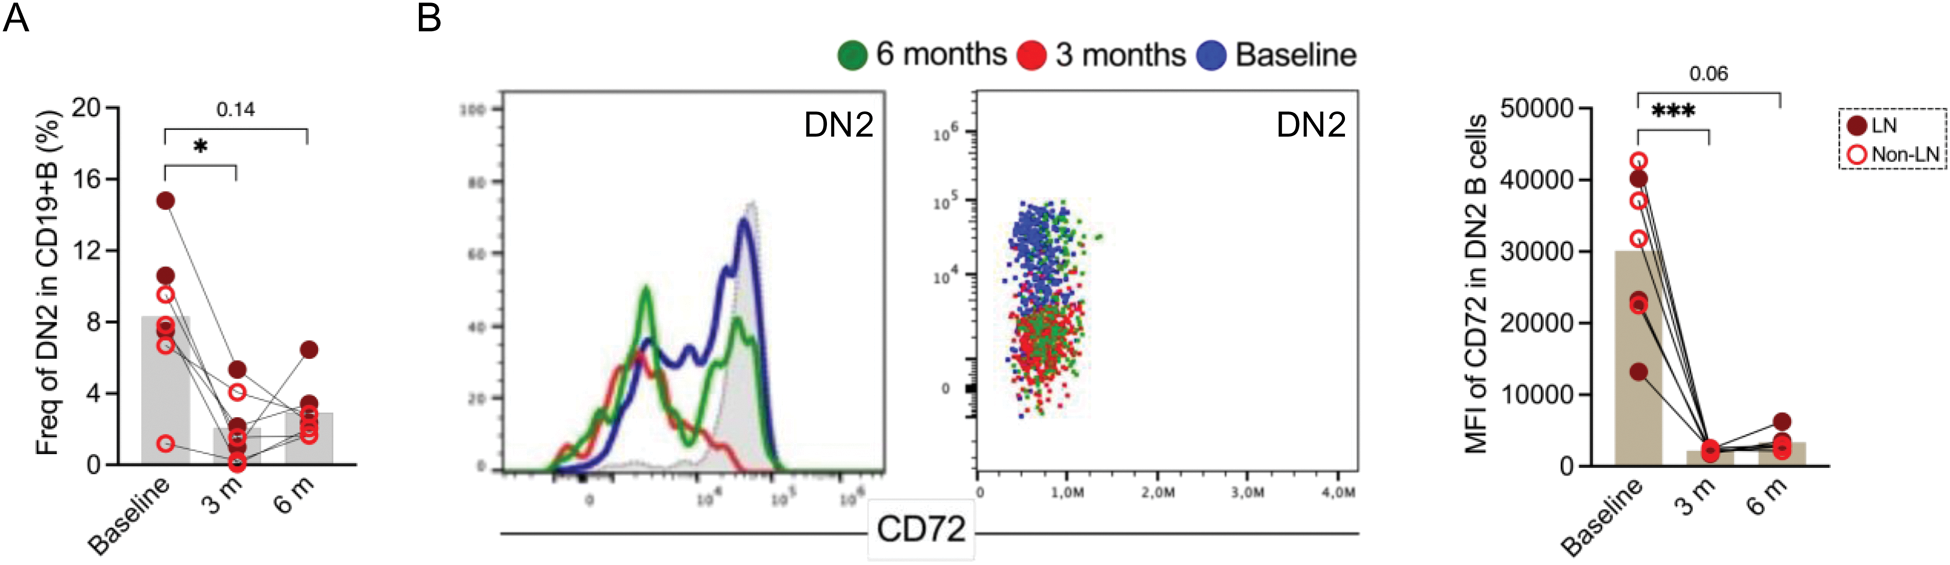
Results: SLE patients were predominantly female (88%), with median age 38 (26 - 47) years and with SLEDAI-2K score of 10 (6 - 12). Overall, ten patients had lupus nephritis (LN). In line with previous studies, we found an increased frequency of CD11c+CD21- B cell subpopulations equivalent to activated naive (aNAV) and double negative 2 (DN2), as well as increased DN3 (CD11c-CD21-) and plasmablasts in SLE patients compared to other groups, with proportions of aNAV and DN2 being particularly elevated in LN patients. We next explored the expression of the inhibitory co-receptor CD72 (Figure 1A), which was downregulated on DN2 and switched memory B cells (SWM: CD27+IgD-) in LN patients, as compared to inactive patients (DN2: p = 0.02 and SWM: p = 0.04) and HC (DN2: p = 0.002 and SWM: p = 0.005) (Figure 1B). In the overall SLE population, the expression levels of CD72 on DN2 B cells correlated inversely with SLEDAI-2K score (r= -0.3, p= 0.04) and positively with C3 levels (r = 0.4, p = 0.004) levels. In LN patients, the correlation of CD72 downregulation with disease activity was even stronger (r= -0.5, p = 0.03). When analyzing the data with respect to anti-dsDNA status, SLE patients with anti-dsDNA positivity displayed a diminished CD72 expression on DN2 (p= 0.0005; Figure 1C) as compared to the anti-dsDNA negative. Longitudinally, overall CD19+ B cells declined in RTX-treated patients at 3 months (p = 0.03) as expected. DN subsets proportions shifted in the early follow-up with DN2 declining (DN2: p = 0.02 at 3 months, Figure 2A). No significant changes of other memory B cell frequencies (SWM, USW and DN1) were observed at different time points. The remaining DN2 cells at 3 months, showed a significant CD72 downregulation in the treated SLE patients (p = 0.0006) as well as in the treated LN (p = 0.02) patients (Figure 2B).
Conclusion: Our data show that expanded DN2 B cells exhibit a reduced expression of the immune checkpoint molecule CD72. This lower expression is observed in anti-dsDNA positive patients, and associates with disease activity, indicating loss of CD72 on DN2 might be involved in disease mechanisms. Reduction of DN2 B cells at early follow-up suggests a transient effect of RTX on these cells. Furthermore, the loss of CD72 expression in DN2 B cells after RTX treatment indicates that these remaining cells may impair immune checkpoint program and be prone to producing autoantibodies. Therefore, research on CD72’s role may provide new insights in understanding resistance to B cell depletion.
REFERENCES: NIL.
Downregulation of surface CD72 in lupus double negative 2 and switched memory B cells. (A ) UMAPs represented the CD72 expression in SLE patients and HC. (B ) Decreased CD72 expression in DN2 and SWM of lupus nephritis patients. (C ) DN2 of anti-dsDNA positive patients displayed a decreased CD72 expression.
Loss of CD72 expression in double negative 2 B cells after treatment. (A ) Frequency of DN2 at baseline and follow-up time points (3 and 6 months) in patients. (B ) Histogram overlays and dot plots (left panel: grey histogram represented healthy DN2) represented CD72 expression and MFI of CD72 (right panel) in lupus DN2 at different time points.
Acknowledgements: NIL.
Disclosure of Interests: None declared.
© The Authors 2025. This abstract is an open access article published in Annals of Rheumatic Diseases under the CC BY-NC-ND license (