fetching data ... 
Background: Sphingolipids, an essential signaling molecules for the biological and structural functions of cells, are increasingly recognized as playing an important signaling role in the pathophysiology of chronic inflammatory diseases.
Objectives: We hypothesized that the altered composition and dysregulation of sphingolipids contribute to the pathogenesis of systemic lupus erythematosus (SLE).
Methods: The study included 38 female patients with SLE, subdivided into 11 with biopsy-confirmed lupus nephritis (LN) and 27 without LN, and 30 age-matched healthy controls. Clinical and laboratory data were collected, and serum sphingolipid levels were analyzed using liquid chromatography-tandem mass spectrometry. Statistical analyses, including receiver operating characteristic (ROC) curve analysis and Pearson’s correlation studies, were performed to evaluate the diagnostic utility of sphingolipid markers and their associations with disease activity.
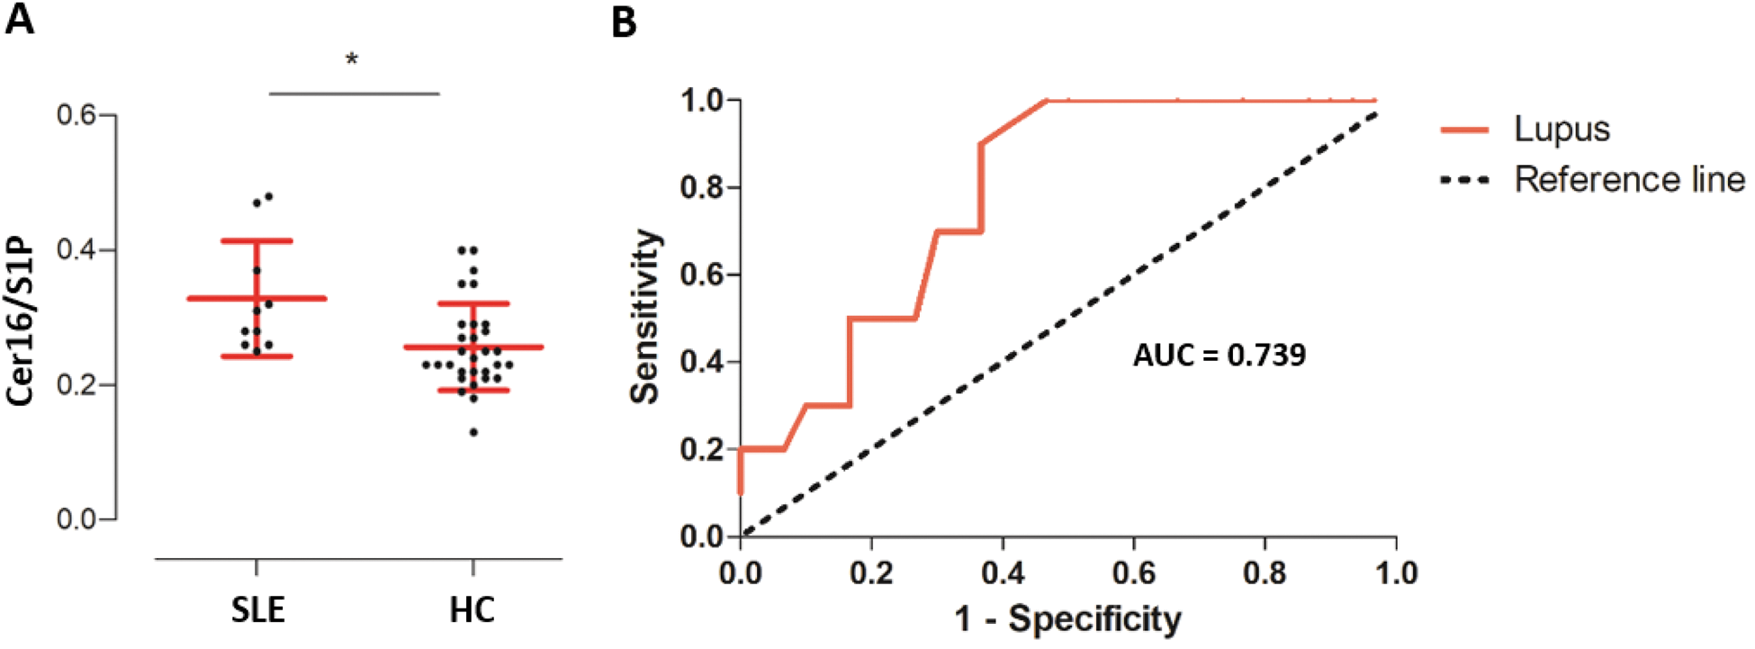
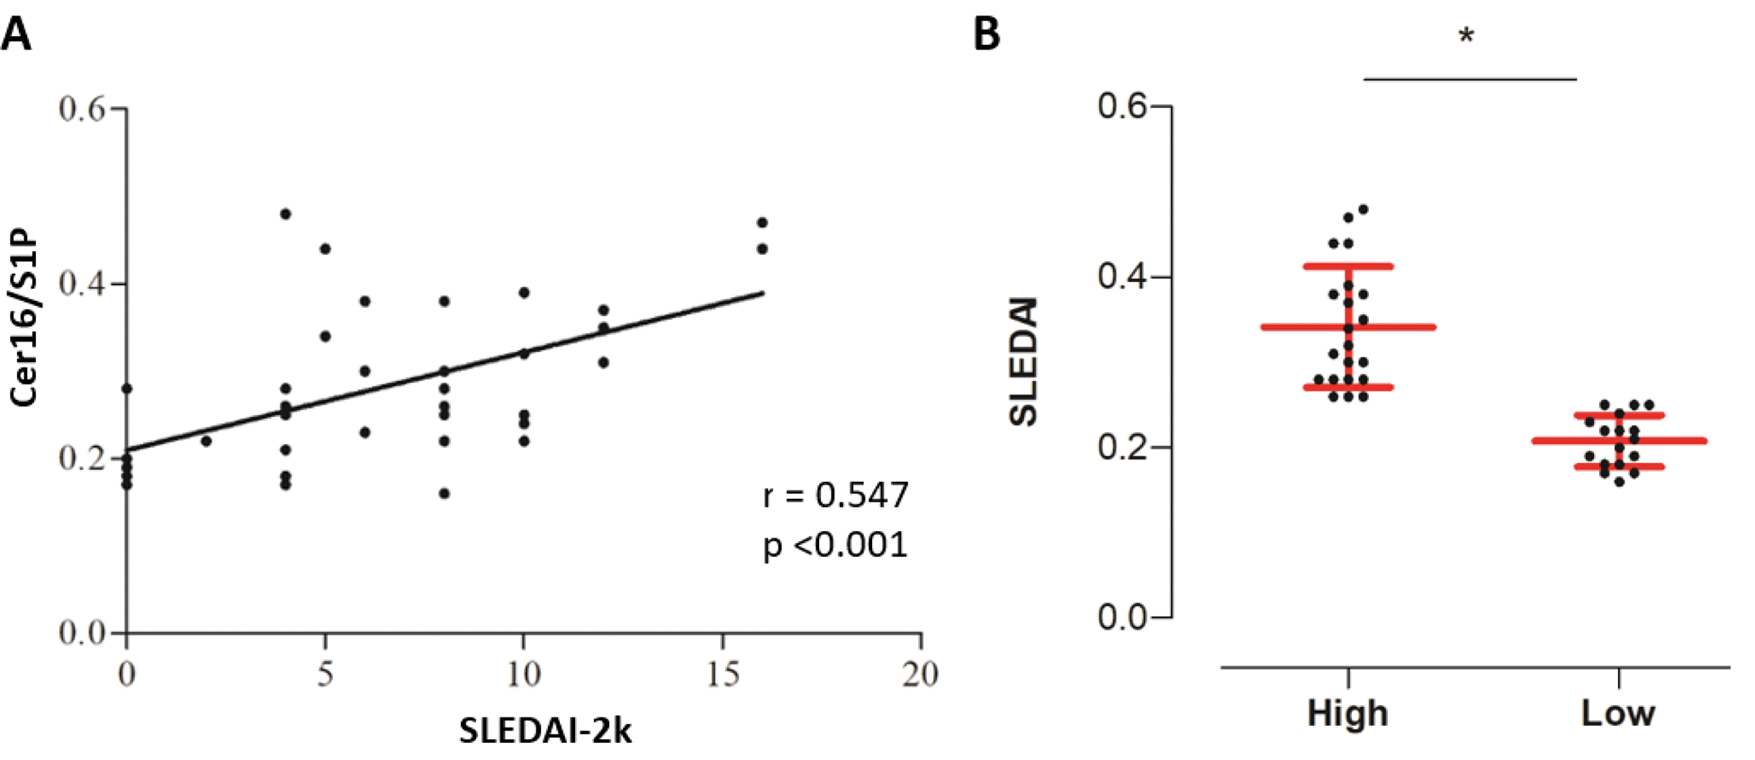
Results: The mean age of SLE patients was 44.5 years and the mean disease duration was 110.7 months. The levels of serum ceramide (Cer) and Cer to sphingosine-1-phosphate (S1P) ratio subspecies were increased in patients with SLE, while the levels of sphingomyelins (d18:0/24:0) were decreased compared to the controls. The most notable difference was observed in the Cer16:0/S1P, which was significantly elevated in the SLE with LN group compared to both SLE without LN (p = 0.027) and healthy controls (p = 0.019). ROC curve analysis demonstrated that the Cer16:0/S1P had good diagnostic potential for identifying LN, with an area under the curve of 0.739. The Cer16:0/S1P positively correlated with disease activity markers, including disease duration (r = 0.373, p = 0.021), erythrocyte sedimantation rate (r = 0.519, p = 0.001), SLE Disease Activity Index 2000 (SLEDAI-2k) score (r = 0.547, p < 0.001), anti-double stranded DNA antibody levels (r = 0.359, p = 0.027), and the Systemic Lupus International Collaborating Clinics/American College of Rheumatology Damage Index (r = 0.327, p = 0.045). Patients with moderate or high disease activity (SLEDAI-2k ≥ 6) exhibited significantly higher Cer16:0/S1P than those with low disease activity (p < 0.001).
Conclusion: The Cer16:0/S1P is a promising biomarker for diagnosing LN and assessing disease activity in SLE. These findings underscore the potential of targeting sphingolipid pathways for therapeutic interventions in SLE, particularly in Korean patients.
REFERENCES: [1] Checa A, Idborg H, Zandian A, Sar DG, Surowiec I, Trygg J, et al. Dysregulations in circulating sphingolipids associate with disease activity indices in female patients with systemic lupus erythematosus: a cross-sectional study. Lupus. 2017;26(10):1023-33.Curtis JR, Chakravarty SD, Black S, Kafka S, Xu S, Langholff W, et al. Incidence of Infusion Reactions and Clinical Effectiveness of Intravenous Golimumab Versus Infliximab in Patients with Rheumatoid Arthritis: The Real-World AWARE Study. Rheumatol Ther. 2021;8(4):1551-63.
[2] Harden OC, Hammad SM. Sphingolipids and Diagnosis, Prognosis, and Organ Damage in Systemic Lupus Erythematosus. Front Immunol. 2020;11:586737.
[3] Green CD, Maceyka M, Cowart LA, Spiegel S. Sphingolipids in metabolic disease: The good, the bad, and the unknown. Cell Metab. 2021;33(7):1293-306.
[4] Maceyka M, Spiegel S. Sphingolipid metabolites in inflammatory disease. Nature. 2014;510(7503):58-67.
A detailed table listing sphingolipid species and their concentrations in patients with SLE with and without nephritis, and healthy controls.
| Sphingolipids (ng/mL) | SLE without LN (N = 27) | SLE with LN (N = 11) | Healthy controls (N = 30) | p-value 1 | p-value 2 |
|---|---|---|---|---|---|
| S1P | 707.4 ± 93.1 | 644.9 ± 114.9 | 710.6 ± 119.3 | 0.208 | 0.380 |
| Sphingosine | 3.92 ± 2.35 | 2.7 ± 1.02 | 3.25 ± 1.56 | 0.155 | 0.680 |
| Cer14:0 | 7.04 ± 2.31 | 7.86 ± 1.91 | 7.07 ± 1.95 | 0.512 | 0.671 |
| Cer16:0 | 184.1 ± 47.9 | 198.2 ± 33.2 | 177.9 ± 35.8 | 0.372 | 0.140 |
| Cer18:0 | 98.9 ± 35.2 | 106.1 ± 27.8 | 94 ± 34.7 | 0.591 | 0.081 |
| Cer20:0 | 116.7 ± 34.4 | 125 ± 30.5 | 120.3 ± 29.1 | 0.754 | 0.319 |
| Cer24:0 | 2,197.3 ± 706.7 | 1,977.7 ± 545 | 2,314.1 ± 569.7 | 0.313 | 0.145 |
| Cer24:1 | 771 ± 217.4 | 795.6 ± 149.6 | 720.5 ± 155.1 | 0.406 | 0.387 |
| SM(d18:0/16:0) | 25,902.1 ± 6,263.2 | 26,625.8 ± 4,281.7 | 27,659.8 ± 4,922.3 | 0.474 | 0.583 |
| SM(d18:0/18:0) | 5,894 ± 1,498.1 | 6,290.1 ± 1,070.9 | 6,554.7 ± 1,498.3 | 0.231 | 0.140 |
| SM(d18:0/24:0) | 17,126.9 ± 4,263.7 | 16,441.5 ± 5,358.1 | 19,453.7 ± 4,611.4 | 0.027 | 0.053 |
| SM(d18:0/24:1) | 34,201.4 ± 9,038.3 | 34,652.8 ± 6,113.8 | 34,414.9 ± 7,179 | 0.986 | 0.934 |
| Cer14/S1P | 0.010 ± 0 | 0.012 ± 0 | 0.010 ± 0 | 0.110 | 0.031 |
| Cer16/S1P | 0.27 ± 0.09 | 0.32 ± 0.09 | 0.26 ± 0.06 | 0.027 | 0.019 |
| Cer18/S1P | 0.14 ± 0.06 | 0.17 ± 0.07 | 0.13 ± 0.05 | 0.189 | 0.107 |
| Cer20/S1P | 0.17 ± 0.05 | 0.2 ± 0.07 | 0.17 ± 0.05 | 0.215 | 0.283 |
| Cer24/S1P | 3.12 ± 1 | 3.15 ± 1.14 | 3.35 ± 1.06 | 0.691 | 0.198 |
| Cer24:1/S1P | 1.11 ± 0.34 | 1.28 ± 0.37 | 1.04 ± 0.27 | 0.111 | 0.031 |
SLE, systemic lupus erythematosus; LN, lupus nephritis; S1P; sphingosine-1-phosphate; Cer; ceramide, SM; sphingomyelin
1SLE+LN vs. HC, 2LN vs. HC.
Bold values indicate significant P value
Elevated serum ceramide (16:0) to sphingosine-1-phosphate ratio and its diagnostic performance for lupus nephritis.
(A) Comparisons between SLE and healthy control. (B) Receiver operating characteristic curve of serum ceramide (16:0) to sphingosine-1-phosphate ratio ratio for discriminating the LN group from the healthy control group. ROC, receiver operating characteristic. LN, lupus nephritis
Association of serum ceramide (16:0) to sphingosine-1-phosphate ratio with SLE disease activity index-2k.
SLEDAI, systemic lupus erythematosus disease activity index-2000
Acknowledgements: NIL.
Disclosure of Interests: None declared.
© The Authors 2025. This abstract is an open access article published in Annals of Rheumatic Diseases under the CC BY-NC-ND license (