fetching data ... 
Background: Cardiovascular disease (CVD) causes 50% more deaths in RA than the wider population, mainly due to accelerated atherosclerosis and is observed in very early RA. Immune dysregulation, systemic inflammation and cardiometabolic changes are thought to play a prominent role. A first multi-parametric cardiovascular magnetic resonance (CMR) study in very early RA identified significantly lower aortic distensibility (AD) in RA compared to matched controls that improved on treatment over a 12-month period.
Objectives: The aim of this study was to identify blood-based metabolic profiles associated with abnormal AD in treatment naïve early RA.
Methods: CMR measures of AD, RA disease activity (DAS28 and its sub-components) and blood samples for biomarker profiling were obtained at pre-treatment (baseline) from participants taking part in the Coronary Artery Disease Evaluation in Rheumatoid Arthritis (CADERA) study. AD was categorised into ‘normal’ or ‘abnormal’ using published reference ranges from morphological and functional CMR parameters. Two-hundred and forty-nine targeted metabolites and metabolite ratios that span multiple pathways, including lipoprotein lipids in 14 subclasses, were quantified in baseline serum samples, using nuclear magnetic resonance (NMR) based technology. Metabolites were pre-processed by removing metabolites relating to percentage proportions (eg. % HDL), removing outliers (4*the interquartile range (IQR) from the median) and those metabolites with >20% missing data. The remaining metabolites were log transformed before unit variance scaling and K-nearest neighbour imputation. To classify AD status, Random Forest (RF) Classifier models were trained, inputting only the preprocessed metabolite values. RF models were developed under robust nested cross validation, with hyperparameter tuning in the nested inner-folds. Following tuning, a final model was trained in the whole dataset using the optimised hyperparameters. Model performance was assessed using (balanced) accuracy and area under the receiver operating characteristic curve (ROC-AUC). The most important features from the final model were selected using the mean decrease in impurity method.
Results: Following quality control, 171 metabolites were available for analysis in 75 patients (clinical characteristic summary in Table 1). 59 patients were categorised with normal AD and 16 with abnormal AD. The RF model was able to classify AD status with accuracy 0.77 (±0.06), balanced accuracy 0.58 (±0.04) and ROC AUC 0.70(±0.24). The importance of the top 30 features in the final model are presented in Figure 1.
Summary of the baseline clinical characteristics of patients with metabolite and AD assessments.
| Clinical Feature | Normal AD (n = 59) | Low AD (n = 16) |
|---|---|---|
| Age at baseline in years: mean(SD ) | 49.25 (12.94) | 46.38 (13.23) |
| Female sex: count(% ) | 39(66) | 14(86) |
| Smoking Status: current/past/never | 12/21/26 | 2/5/9 |
| Seropositivity (RF and/or ACPA): count(% ) | 42(71) | 9(56) |
| DAS28-ESR: mean(SD ) | 5.74 (1.02) | 5.31 (1.23) |
| AD: mean(SD ) | 3.59 (1.53) | 2.5 (1.09) |
Top 30 most impactful features in the final model. S_HDL_C: cholesterol in small high density lipoprotein (HDL) particles, S_HDL_CE: cholesterol esters in small HDL particles, XL_HDL_FC: free cholesterol in extra large HDL particles, Ile: isoleucine, VLDL_size: diameter of very low density lipoprotein (VLDL) particles, ApoB: Apolipoprotein B, S_HDL_L: total lipids in small HDL particles, XXL_VLDL_C: cholesterol in extra extra large (XXL) VLDL particles, MUFA: monounsaturated fatty acids, L_HDL_P: concentration of large HDL particles, M_VLDL_L: total lipids in medium sized VLDL particles, L_LDL_TG: triglycerides in large low density lipoprotein (LDL) particles, Gly: glycine, S_LDL_TG: triglycerides in small LDL particles, M_VLDL_CE: cholesterol esters in medium sized VLDL particles, XXL_VLDL_FC: free cholesterol in XXL VLDL particles, XL_VLDL_TG: triglycerides in extra large VLDL particles, Tyr: tyrosine, IDL_C: cholesterol in intermediate density lipoprotein particles, L_VLDL_TG: triglycerides in large VLDL particles, Total_BCAA: total branched chain amino acids, IDL_PL: phospholipids in intermediate density lipoproteins, PUFA: polyunsaturated fatty acids, S_HDL_P: concentration of small HDL particles, XL_HDL_L: total lipids in extra large HDL particles.
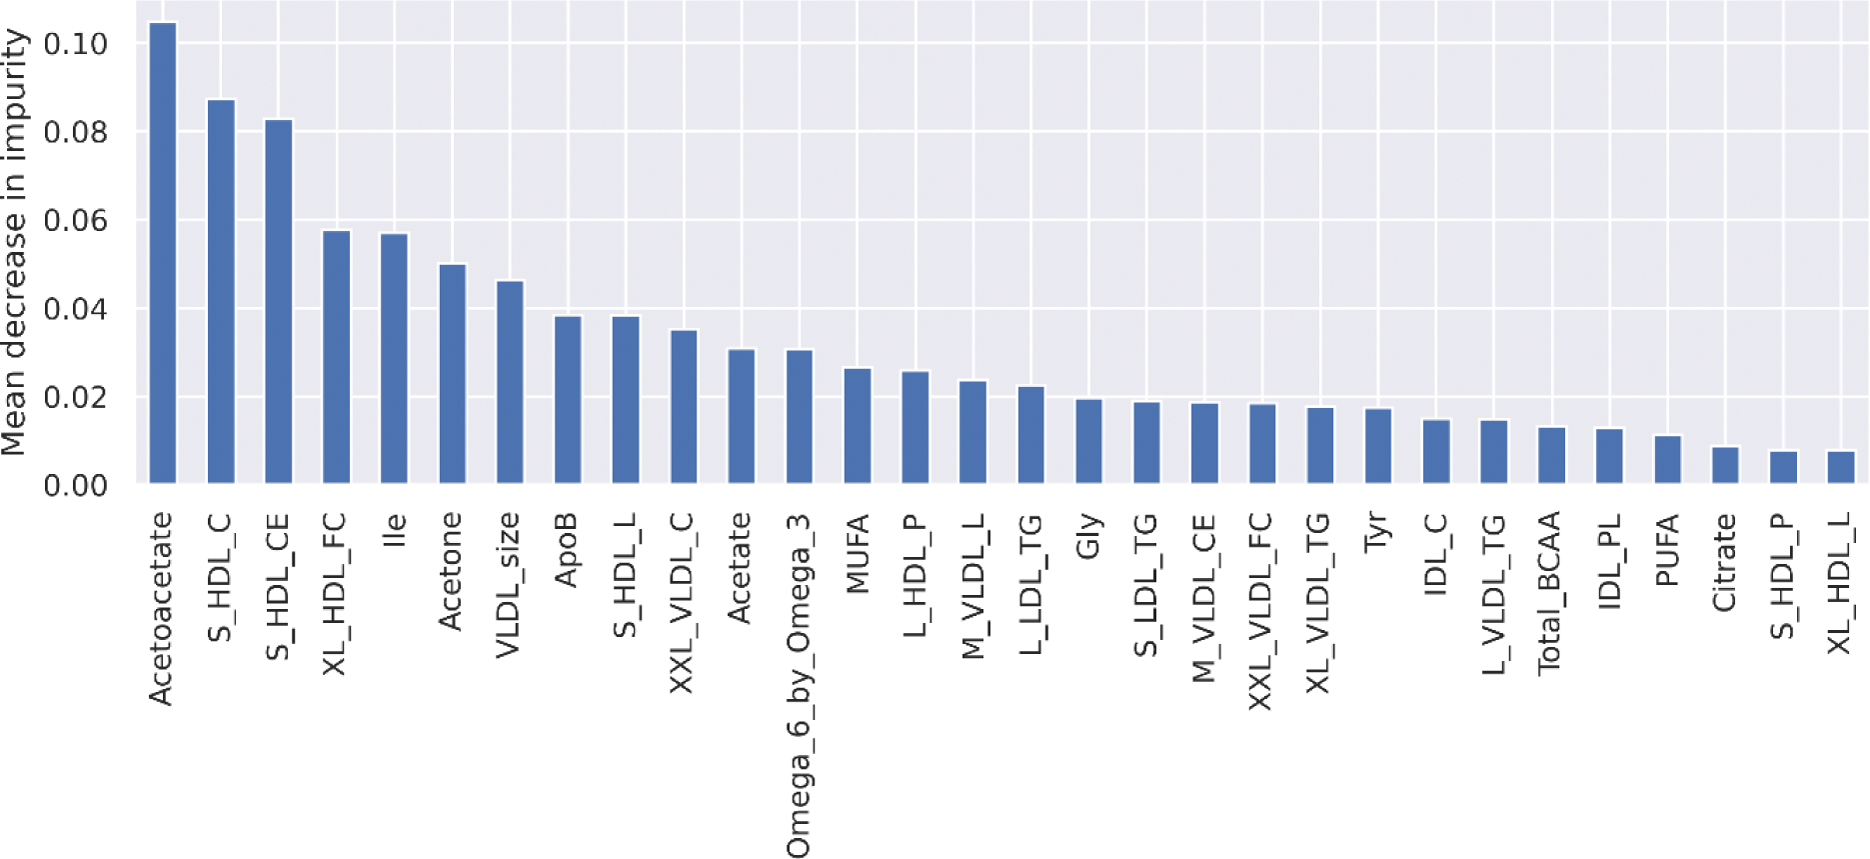
Conclusion: Pre-treatment metabolite profiles classify AD status determined at the same timepoint with moderate performance. The most impactful features for classifying AD status included various cholesterol, triglyceride and lipoprotein particles; that are known to be involved in atherogenic CVD progression. Other important features included glycolysis related metabolites and ketone bodies. Further analysis is now required to investigate the relationship between pre-treatment metabolite profiles and change in AD status following commencement of RA medication, to identify metabolite profiles that covary with RA medication use and to confirm these results in independent patients.
REFERENCES: NIL.
Acknowledgements: This work was supported by the Medical Research Council [grant number MR/W007428/1].
Disclosure of Interests: Andrew Millar-Wilson: None declared. Bara Erhayiem: None declared. Graham Fent: None declared. Sven Plein: None declared. Nisha Nair: None declared. John Bowes: None declared. Maya Buch Honoraria and/or advisory board from AbbVie, AstraZeneca, Boehringer Ingelheim, Galapagos, Gilead, Pfizer; Meeting support from Boehringer Ingelheim and UCB, All paid to University to Manchester: Research grant from Gilead, Darren Plant: None declared.
© The Authors 2025. This abstract is an open access article published in Annals of Rheumatic Diseases under the CC BY-NC-ND license (