fetching data ... 
Background: The course of systemic lupus erythematosus (SLE) is often unpredictable, with alternating phases of remission and activity. In clinical practice, it would be highly beneficial to predict these activity phases, even in the medium term, to adjust therapy accordingly. To address this, a machine learning model was developed to predict the occurrence of an activity event within 12 months(main model) [1], based on SLE patient features from the current contact, the previous contact, and the overall disease history. While the main model demonstrates robust predictive power for the majority of the cohort, for a subset of 30% of patients, additional analyses are required to complement the AI model and achieve reliable predictions.
Objectives: The objectives of this study are to: 1) provide an overview of the performance of the main model, 2) analyze the characteristics of patients whose disease course could not be reliably predicted by the main model, 3) demonstrate the final improved performance achieved through the integration of a cascade model.
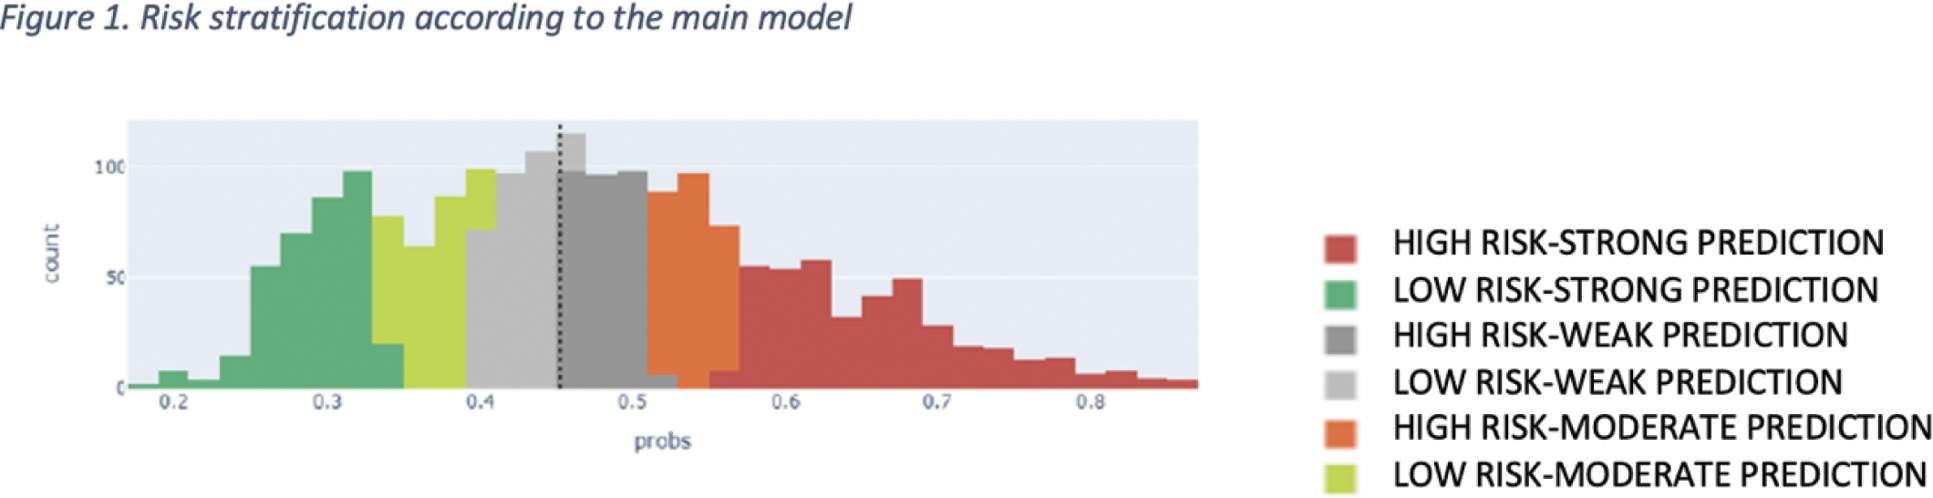
Methods: The main model employs a Random Forest architecture and was developed using an SLE cohort followed up at our center. Based on a patient’s status at a given point in time (“current contact”), the main model outputs a predicted probability (PP) of an activity event occurring within the following 12 months. A prediction threshold of 0.45 was determined during the model’s training phase, classifying patients as high risk (PP>0.45) or low risk (PP<0.45). The closer the PP is to the prediction threshold, the greater the uncertainty of the prediction, necessitating further analysis. Reliability thresholds were established based on the distributions of true positive and true negative cases. Characteristics of these uncertain (‘weak’) cases were compared to those with stronger predictability using the Mann-Whitney test or Chi-squared test, as appropriate. To address the weak-prediction cases, a decision tree model was trained using a reduced set of features (e.g., demographic and treatment data) that were not included in the main model. This cascade model identified the most predictive decision paths, providing rule-based predictions to enhance reliability specifically for the uncertain cases.
Results: The cohort consisted of 262 SLE patients, comprising a total of 5952 contacts recorded between 2012 and 2020. Seventy percent of the cohort was used to train the main and cascade models, while 30% (1845 contacts) was reserved for evaluation. The distribution of contacts across high- and low-risk categories, as well as the uncertainty range, is depicted in Figure 1 for the test set. Compared to cases with reliable prediction scores (n=1255), weak cases (n=590) were characterized by a higher frequency of male patients, older age, increased prevalence of serosal, vascular, and cutaneous involvement, greater corticosteroid use, and lower use of antimalarials. While the overall use of biological therapy was not statistically significant in this context, reliability significantly improved in the subset of patients treated with Rituximab, consistent with a higher level of disease control and reduced risk of activity events. Age, gender, and therapies (which were not included in the main model) were used as input features in a decision tree model applied specifically to weak predictions. The main model achieved an AUC of 74.2% when weak predictions were excluded. Integration of the cascade model enhanced the coverage of weak predictions, resulting in a final AUC of 74.3%.
Conclusion: This approach broadens the range of reliable predictions while maintaining predictive accuracy, providing an enhanced decision-support system for personalized management of SLE. This approach broadens the range of reliable predictions while maintaining predictive accuracy, enabling a more precise and personalized decision-support system for SLE management. By integrating advanced machine learning techniques, it provides a valuable tool for clinicians to better anticipate disease activity, optimize therapy adjustments, and potentially improve patient outcomes.
Comparison of SLE patients’ features between reliable and weak prediction according to the main model
| Feature | Reliable
| Weak
| p-Value |
|---|---|---|---|
| Male patients | 130(10.3%) | 100 (16.9%) | <0.0001 |
| Age at contact yy | 46 (31.5) | 52 (36.6) | <0.0001 |
| Organ involvement | |||
| Cutaneous involvement | 1101 (87.7%) | 550 (93.2%) | < 0.0001 |
| Hematological involvement | 1010 (80.5%) | 477 (80.9%) | 0.85 |
| Neurologic involvement | 281 (22.4%) | 137 (23.2%) | 0.69 |
| Renal involvement | 888 (70.8%) | 430 (72.9%) | 0.35 |
| Sierositic involvement | 231 (18.4%) | 185 (31.4%) | < 0.0001 |
| Systemic involvement | 432 (34.4%) | 171 (28.9%) | < 0.05 |
| Vascular involvement | 674 (53.7%) | 376 (63.7%) | < 0.0001 |
| Lab examination | |||
| Anemia (<8 g/dL) | 254(20.2%) | 107 18.1%) | 0.29 |
| Leukopenia (<3000/mmc) | 174 (13.9%) | 52(8.8%) | < 0.05 |
| Thrombocytopenia (<100.000) | 21 (1.7%) | 10 (1.7%) | 0.97 |
| Hematuria (>5 RBC/mmc) | 79 (6.29%) | 12 (2.03%) | < 0.0001 |
| Proteinuria>0.5 g/day | 101 (8.05%) | 14 (2.37%) | < 0.0001 |
| CRP positive (≥5 mg/L) | 218 (17.37%) | 108 (18.3%) | 0.62 |
| Elevated ESR | 286 (22.79%) | 106 (17.9%) | <0.05 |
| T reatment | |||
| Antimalarials | 731(58.3%) | 311(52.7%) | < 0.05 |
| Conventional immunosuppressant | 706 (56.3%) | 313(53.1%) | 0.19 |
| Biological immunosuppressant | 293 (23.4%) | 117 19.8%) | 0.09 |
| Glucocorticoids | 596 (47.5%) | 351 (59.5%) | < 0.0001 |
| Articular involvement | 930 (74.1%) | 438 (74.2%) | 0.95 |
| Rituximab | 51 (4.1%) | 13 (2.2%) | < 0.05 |
Legend. For categorical variables, occurrences in absolute and percentage format are reported, while for the numerical variables, median is shown with first and third quartiles.CRP= C Reactive Protein;ESR= Erythrocyte Sedimentation rate.
REFERENCES: [1] Livia Lilli, et al. A Hierarchical Machine Learning Model for One-Year Prediction of Activity in Systemic Lupus Erythematosus, submitted.
Acknowledgements: This work was funded by AstraZeneca.
Disclosure of Interests: Silvia Laura Bosello Janssen, Boehringer Ingelheim, Janssen, Boehringer Ingelheim, Amgen, Janssen, Boehringer Ingelheim, Amgen, Roche, Astrazeneca, Augusta Ortolan astrazeneca, amgen, Abbvie, Livia Lilli: None declared, Laura Antenucci: None declared, Carlotta Masciocchi: None declared, Marco Gorini: None declared, Gabriella Castellino: None declared, Luca Petricca: None declared, Maria Rita Gigante alfasigma, Viviana Antonella Pacucci alfasigma, Abbvie, Lucia Lanzo: None declared, Pierluigi Rizzuti: None declared, Rebecca Ventura: None declared, Silvia Piunno: None declared, Jacopo Lenkowic: None declared, Alfredo Cesario: None decla.red, Stefano Patarnello: None declared, Maria Antonietta D’ Agostino: None declared.
© The Authors 2025. This abstract is an open access article published in Annals of Rheumatic Diseases under the CC BY-NC-ND license (