fetching data ... 
Background: Osteoarthritis (OA) is the most common rheumatic disease, characterized by progressive joint degeneration, asymmetrical arthralgia, swelling, and loss of joint flexibility. Its prevalence is increasing as populations age, making it a significant cause of disability worldwide [1]. Although OA is traditionally considered a mechanical disease, recent evidence highlights the role of inflammation in its pathogenesis. This involves complex interactions between synoviocyte activation, immune cell infiltration, and cartilage remodeling [2]. These interactions contribute to the aberrant joint architecture and chronic symptoms observed in OA patients. This study investigates the molecular interplay between dysregulated genes and immune cell infiltrates in the synovial tissue of OA patients by leveraging transcriptomic data and immune profiling, aiming to enhance our understanding of the inflammatory mechanisms underlying OA.
Objectives: To analyze the molecular interactions between dysregulated genes and immune cell infiltrates in the synovial tissue of patients with osteoarthritis.
Methods: The transcriptomic profiles of synovial tissue from 10 osteoarthritis (OA) patients and 10 healthy controls (HC) were retrieved from the Gene Expression Omnibus platform (dataset GSE55235). Differentially expressed genes (DEGs) were identified using thresholds of false discovery rate (FDR) < 0.05 and log2 fold change > 2. Functional enrichment analysis of DEGs was performed using the Metascape online resource. Protein-protein interaction (PPI) networks were constructed using the Cytoscape software, and hub genes (HGs) were identified using five different algorithms through the CytoHubba plugin. The immune cell composition of synovial tissue was analyzed using digital cytometry with the CibersortX platform. A 2-way ANOVA test with Sidak’s post-hoc analysis was used to compare immune infiltrate proportions between OA and HC groups. To investigate the relationship between HGs and immune cell proportions, Spearman correlation analysis was performed. Statistical significance was set at p < 0.05.
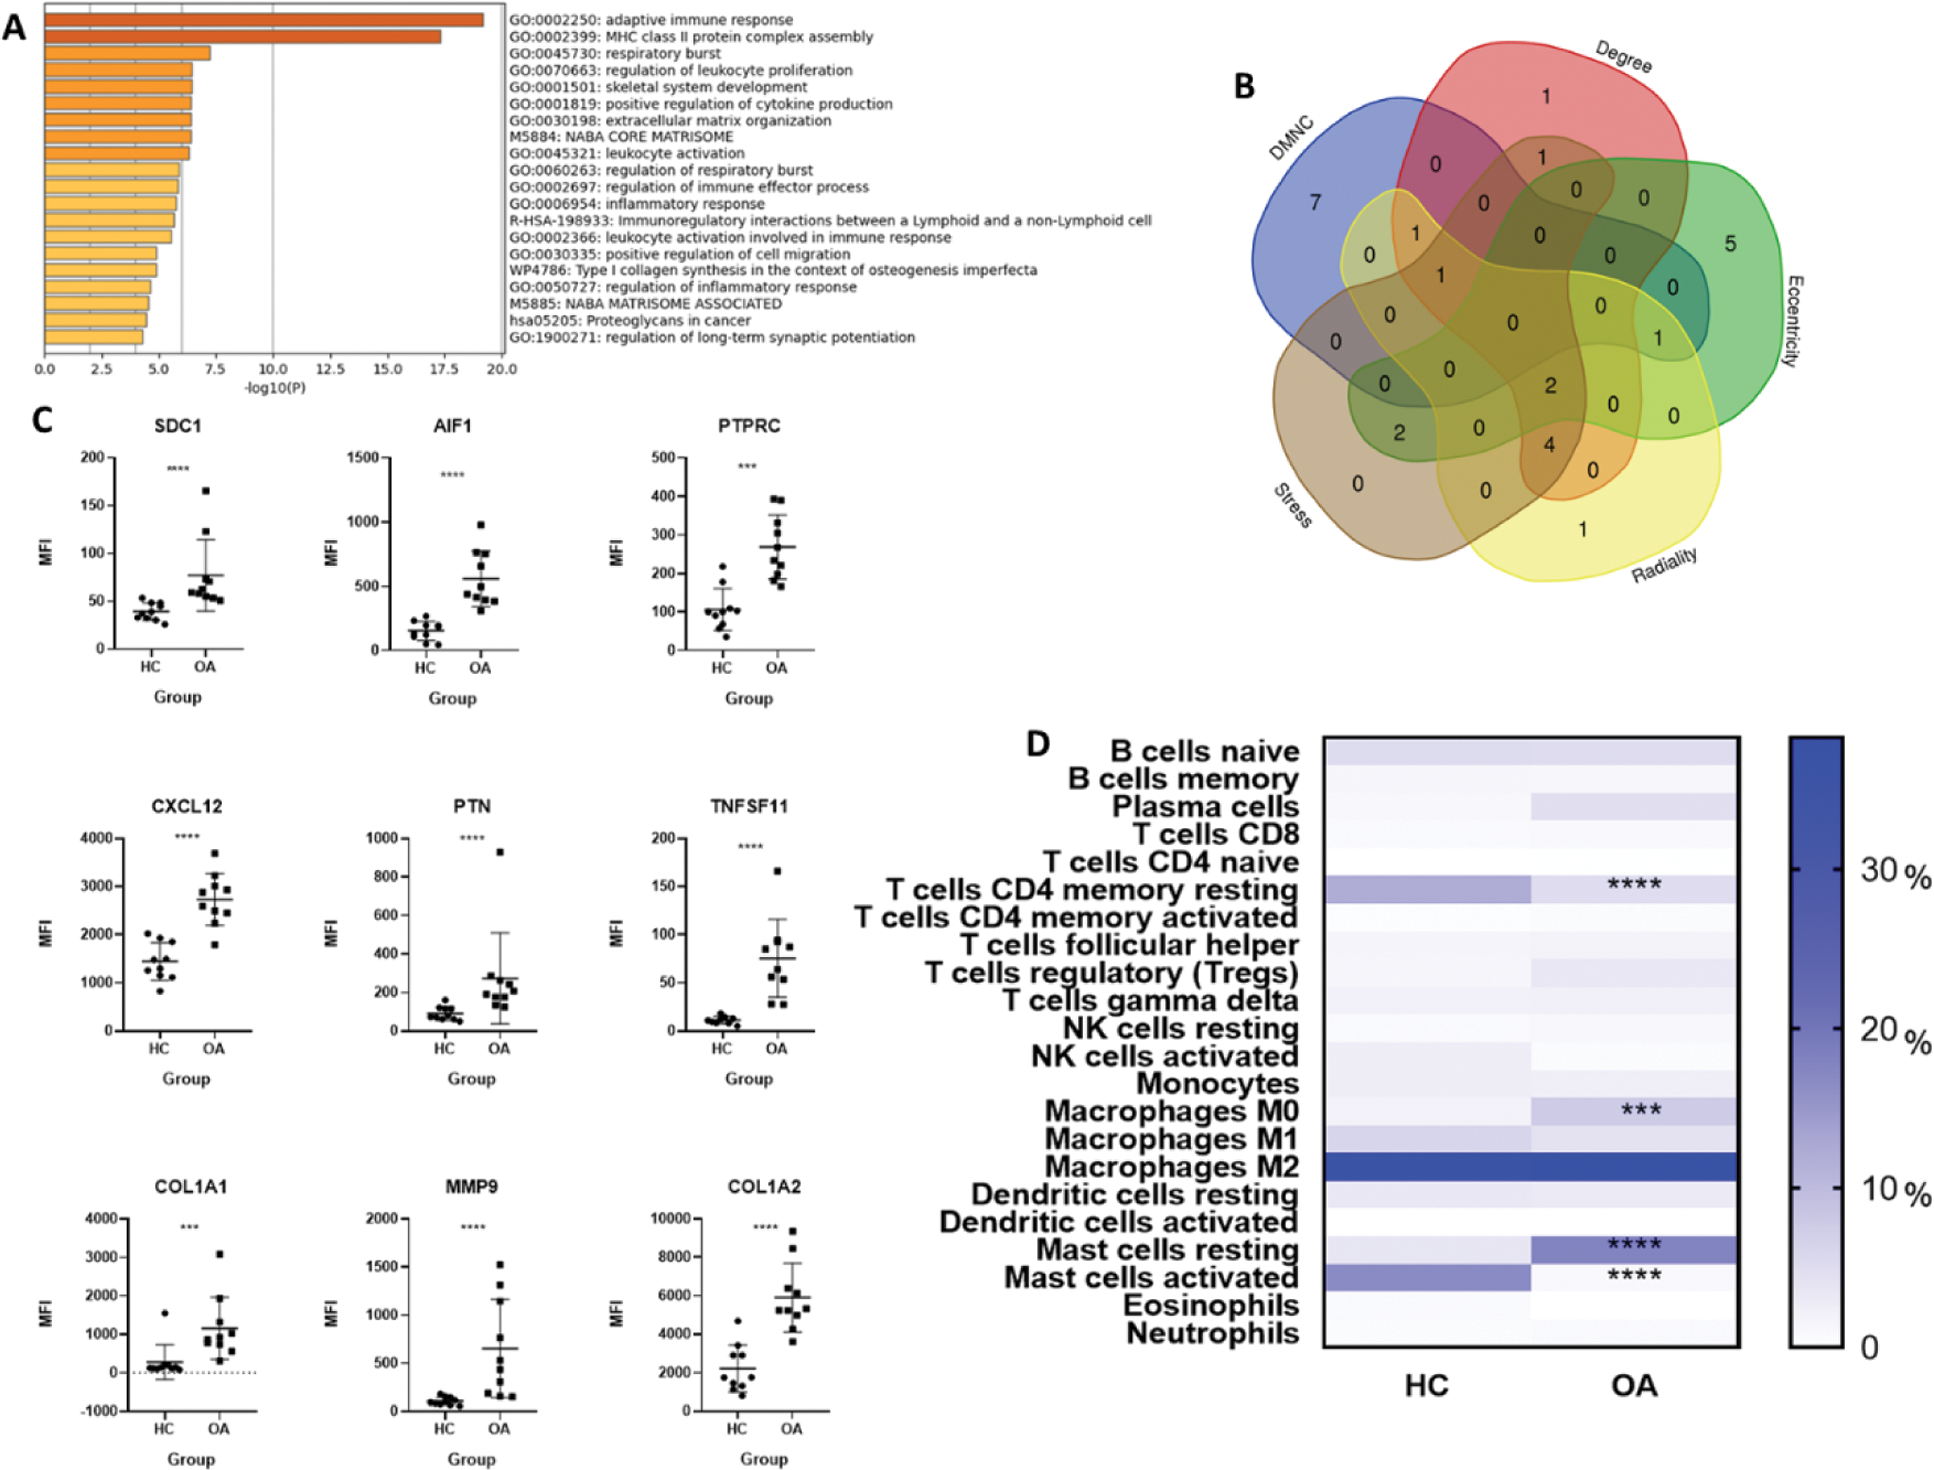
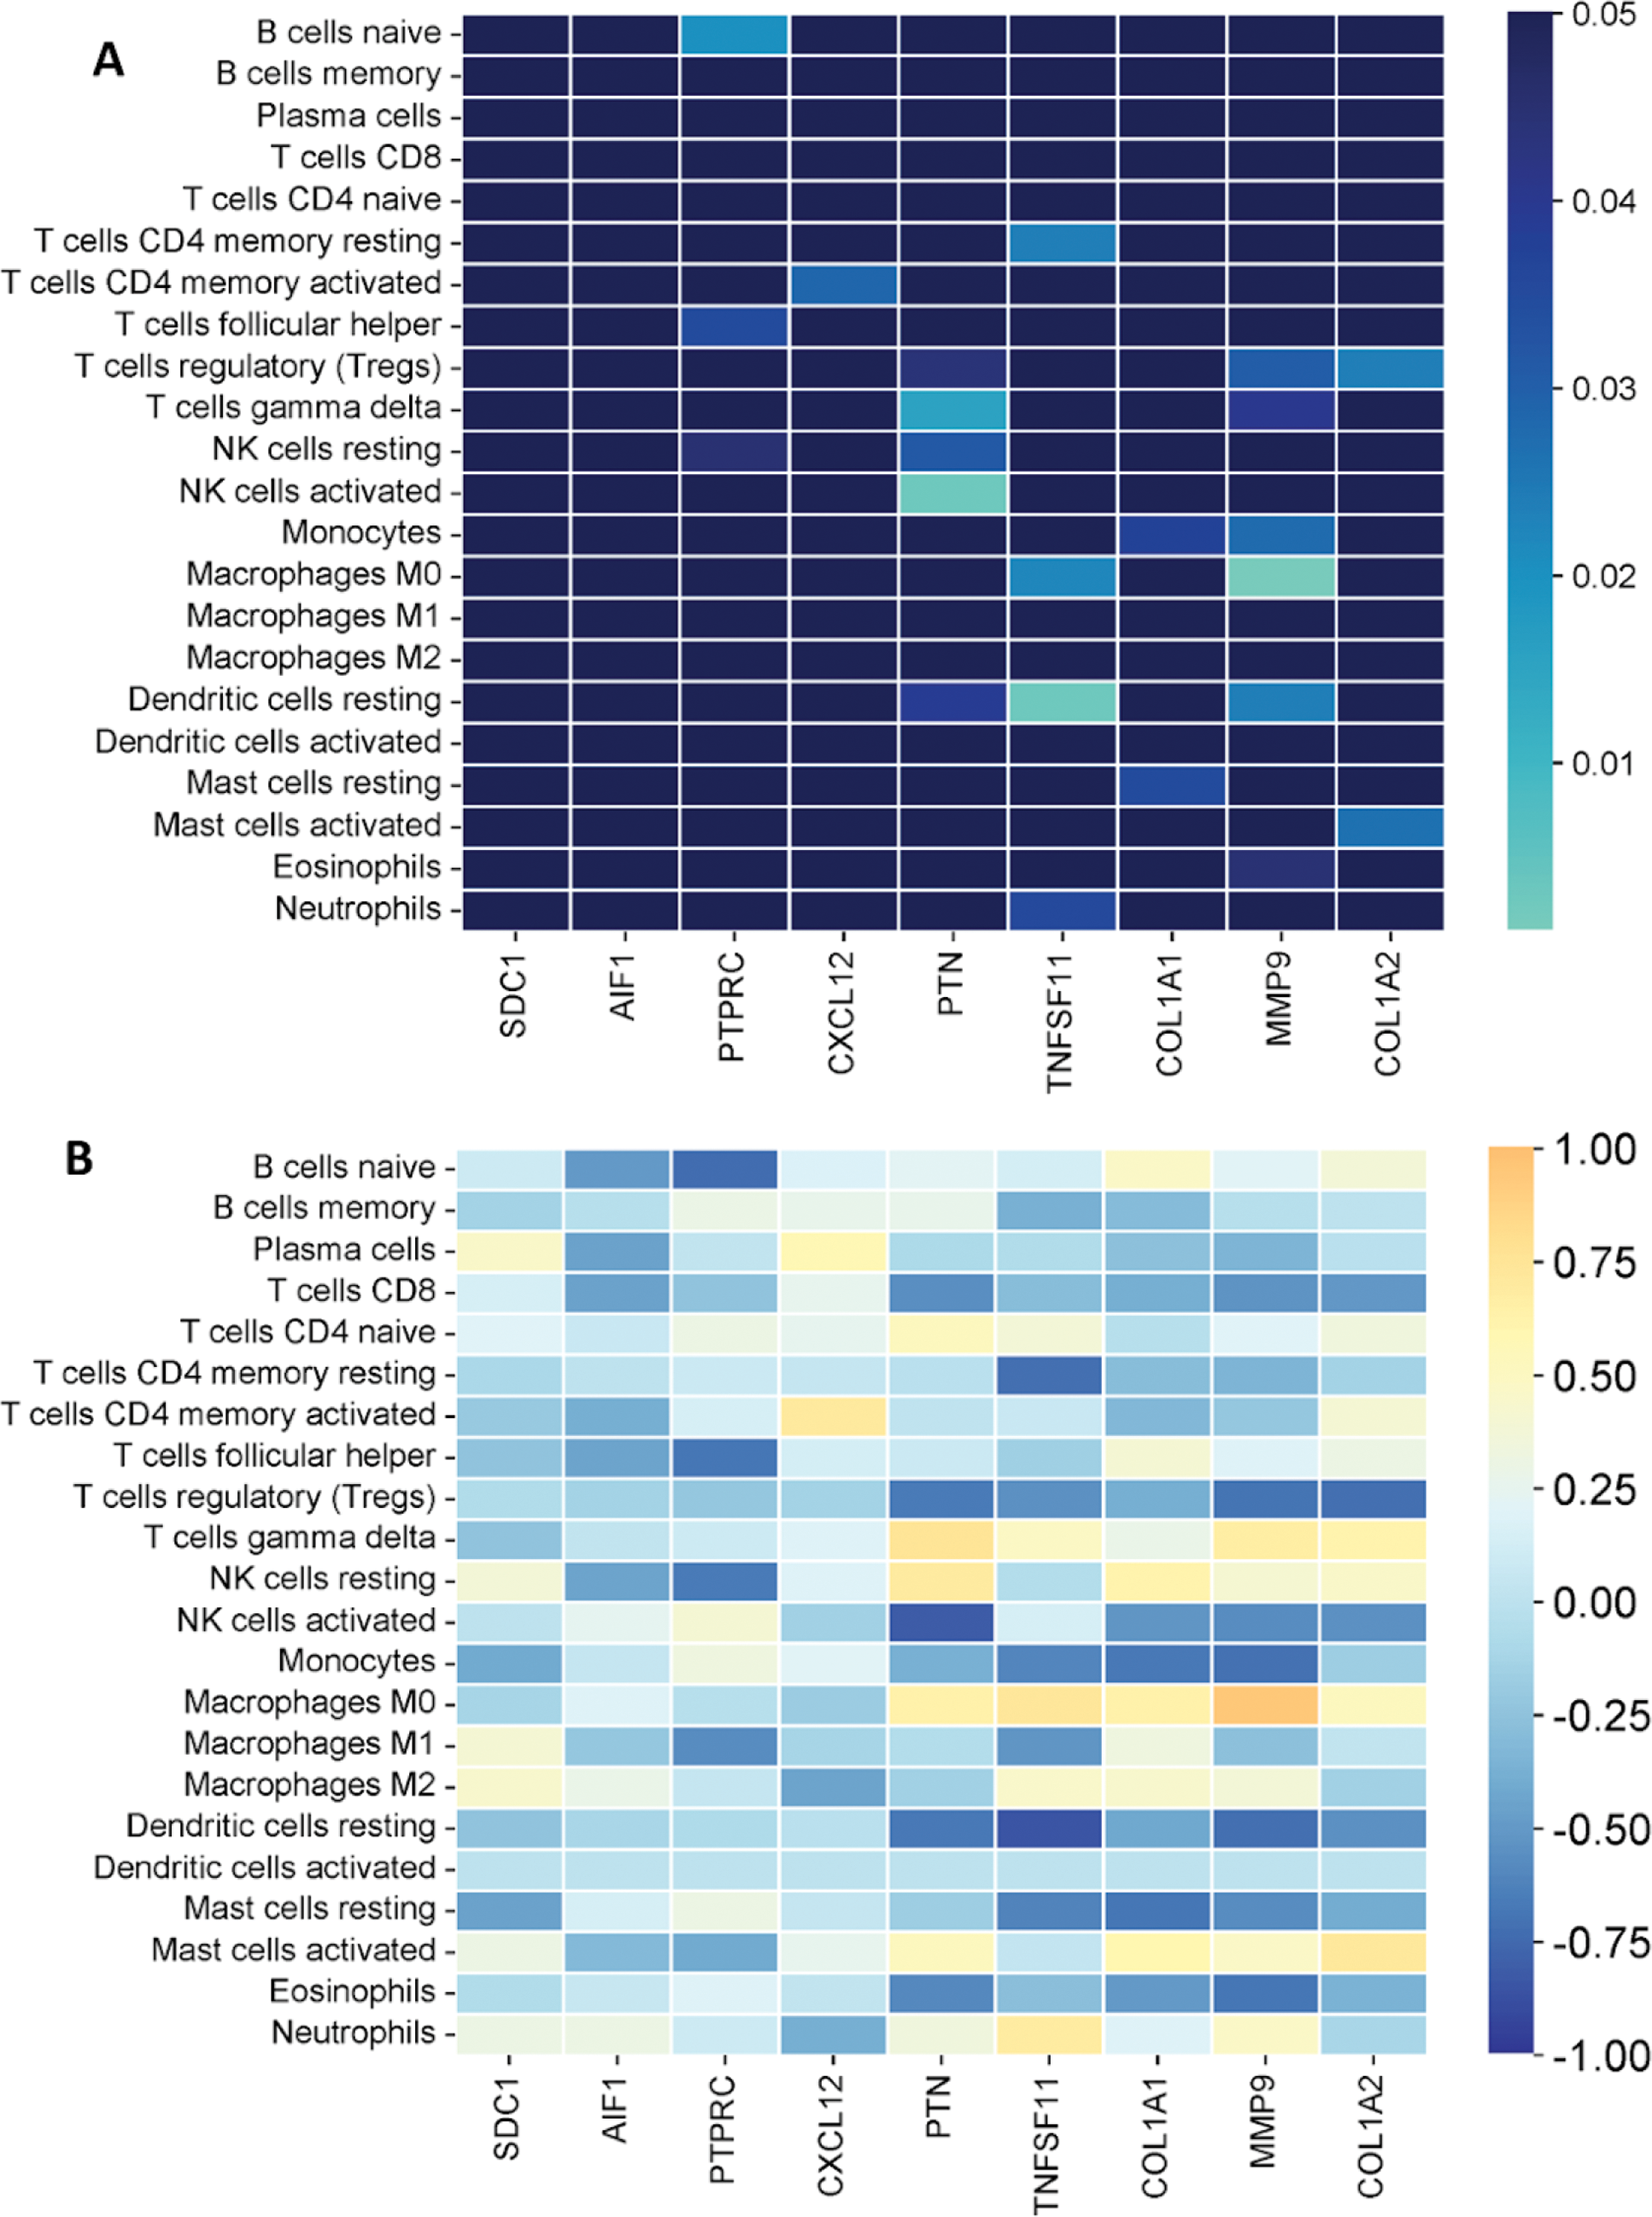
Results: A total of 96 DEGs were identified in the synovial tissue of OA patients compared to healthy controls. These DEGs were associated with biological processes such as adaptive immune responses, MHC class II protein complex assembly, and leukocyte proliferation (Figure 1A). Nine hub genes (HGs) were identified through PPI network analysis, all of which were significantly overexpressed in the OA group (Figures 1B and 1C). The immune cell composition analysis revealed significant differences between OA patients and healthy controls. CD4+ memory resting T cells were significantly reduced in the OA group, whereas M0 macrophages were increased. Additionally, a shift in mast cell activity was observed, with activated mast cells predominating in healthy controls and resting mast cells being more prominent in OA patients (Figure 1D). Correlation analysis showed significant relationships between HG expression and immune cell proportions, except for SDC1 and AIF1 (Figures 2A and 2B). Notably, strong correlations were observed between MMP9 and M0 macrophages, suggesting their pivotal role in OA pathogenesis.
Functional enrichment analysis, hub gene identification, and immune infiltrate patterns in osteoarthritis. (A) Functional enrichment analysis of 96 differentially expressed genes (DEGs), highlighting processes such as adaptive immune response, MHC class II assembly, and leukocyte proliferation. (B) Identification of hub genes (HGs) using the CytoHubba plugin with five algorithms. (C) Mean fluorescence intensity (MFI) values of HGs in OA and HC groups, analyzed using the Mann-Whitney U test. (D) Immune cell proportions in synovial tissue, showing a significant decrease in CD4+ memory resting T cells and an increase in M0 macrophages in OA patients. A shift in mast cell activation was observed between groups. Asterisks (***; ****) indicate a p value < 0.001 and < 0.0001 respectively.
Correlations between hub genes and immune cell infiltrates in osteoarthritis. (A) Statistical significance of correlations, depicted as color gradients where darker blue represents non-significant (p > 0.05) and lighter blue to green represents significant (p < 0.05). (B) Strength and direction of correlations, represented on a color scale from orange (+1) to blue (-1).
Conclusion: This study highlights the interplay between dysregulated genes and immune cell infiltration in the synovial tissue of osteoarthritis patients. Key findings include significant differences in immune cell proportions, such as reduced CD4+ memory resting T cells and increased M0 macrophages, as well as a shift in mast cell activity. Hub genes such as MMP9 were strongly correlated with M0 macrophages, suggesting their critical role in OA pathogenesis. These findings enhance our understanding of the inflammatory mechanisms underlying OA and support further research into how these molecular and cellular elements evolve with disease severity.
REFERENCES: [1] Prieto-Alhambra, Daniel et al. “Incidence and risk factors for clinically diagnosed knee, hip and hand osteoarthritis: influences of age, gender and osteoarthritis affecting other joints.” Annals of the rheumatic diseases vol. 73,9 (2014): 1659-64. doi:10.1136/annrheumdis-2013-203355.
[2] Loeser, Richard F et al. “Ageing and the pathogenesis of osteoarthritis.” Nature reviews. Rheumatology vol. 12,7 (2016): 412-20. doi:10.1038/nrrheum.2016.65.
Acknowledgements: We’d like to thank the Mexican National Council of Humanities, Science and Technology (CONAHCYT) for providing the academic grant that made this research possible. Grant ID: PCC-2022-320697.
Disclosure of Interests: None declared.
© The Authors 2025. This abstract is an open access article published in Annals of Rheumatic Diseases under the CC BY-NC-ND license (