fetching data ... 
Background: Conventional myeloid dendritic cells (cDCs) have been previously described in the muscle of inclusion body myositis (IBM) patients and may play a role in activation of T C 1 cells and subsequent disease damage [1, 2, 3]. These previously described cDCs in IBM muscle have variably included CADM1 + cDC1 cells [3] and CD1C + cDC2 cells [1, 2]. However, there remains a need to better characterize the specificity of these cDCs in IBM and their role in IBM pathogenesis.
Objectives: In this study, we performed single-cell RNA sequencing (scRNA-seq) on the muscle of one IBM patient to confirm the presence of cDC1 and cDC2 cells and identify their specific markers. We then performed bulk RNA sequencing (RNA-seq) on muscle biopsies from 669 myopathic and non-myopathic patients, including 53 IBM patients, to compare expression of these markers in myositis subtypes and correlate them with markers of disease activity.
Methods: scRNA-seq was performed on a muscle biopsy from one patient with IBM, revealing 3173 cells. The R package Seurat v5 was used to analyze scRNA-seq data. Initial quality control involved removal of cells with <200 or >2500 gene transcripts, removal of cells with >5% mitochondrial genes, and removal of cells with >1% hemoglobin genes, resulting in 2681 cells. Seurat was then used for count transformation, principal component analysis (PCA), UMAP and manual clustering, identification of cluster-specific markers, and Dot Plot generation. RNA-seq was performed on muscle biopsies from 669 patients, including 53 with IBM, 105 with dermatomyositis (DM), 80 with immune-mediated necrotizing myopathy (IMNM), 65 with anti-synthetase syndrome (AS), 19 with anti-PM/Scl overlap myositis (PMScl), 239 with other inflammatory myopathies, 71 with genetic myopathies, and 37 non-myopathic controls (NT). R software was used to generate a median expression heatmap of eight cDC-specific genes identified from scRNA-seq analysis across each myositis subtype. Python software was used to generate correlation heatmaps of the same genes versus representative markers of disease activity for both IBM and non-IBM patients.
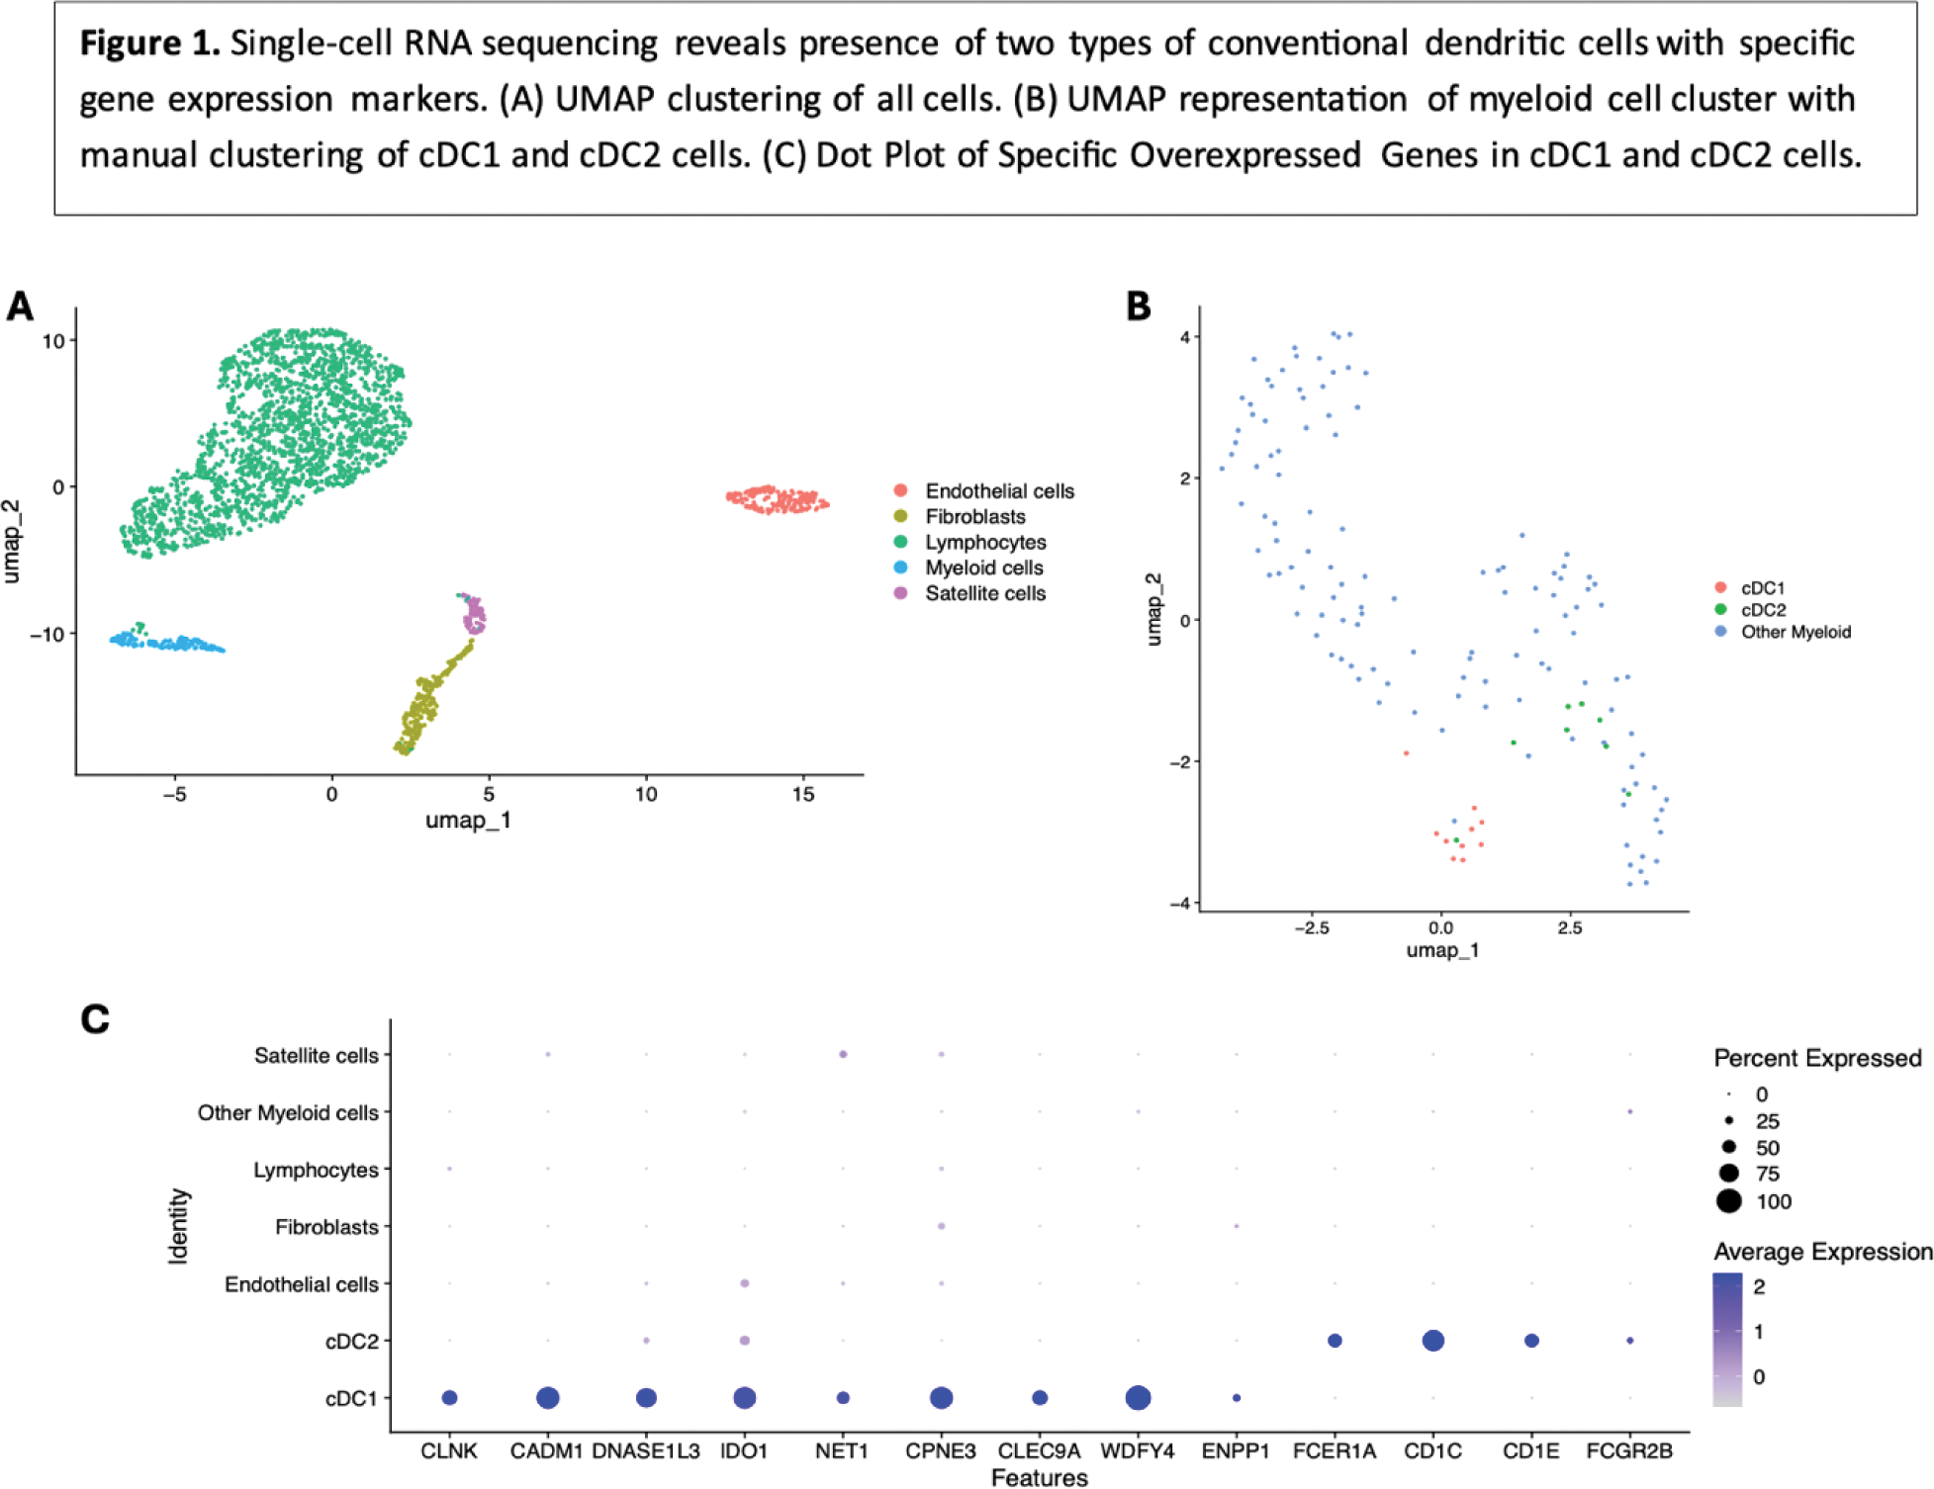
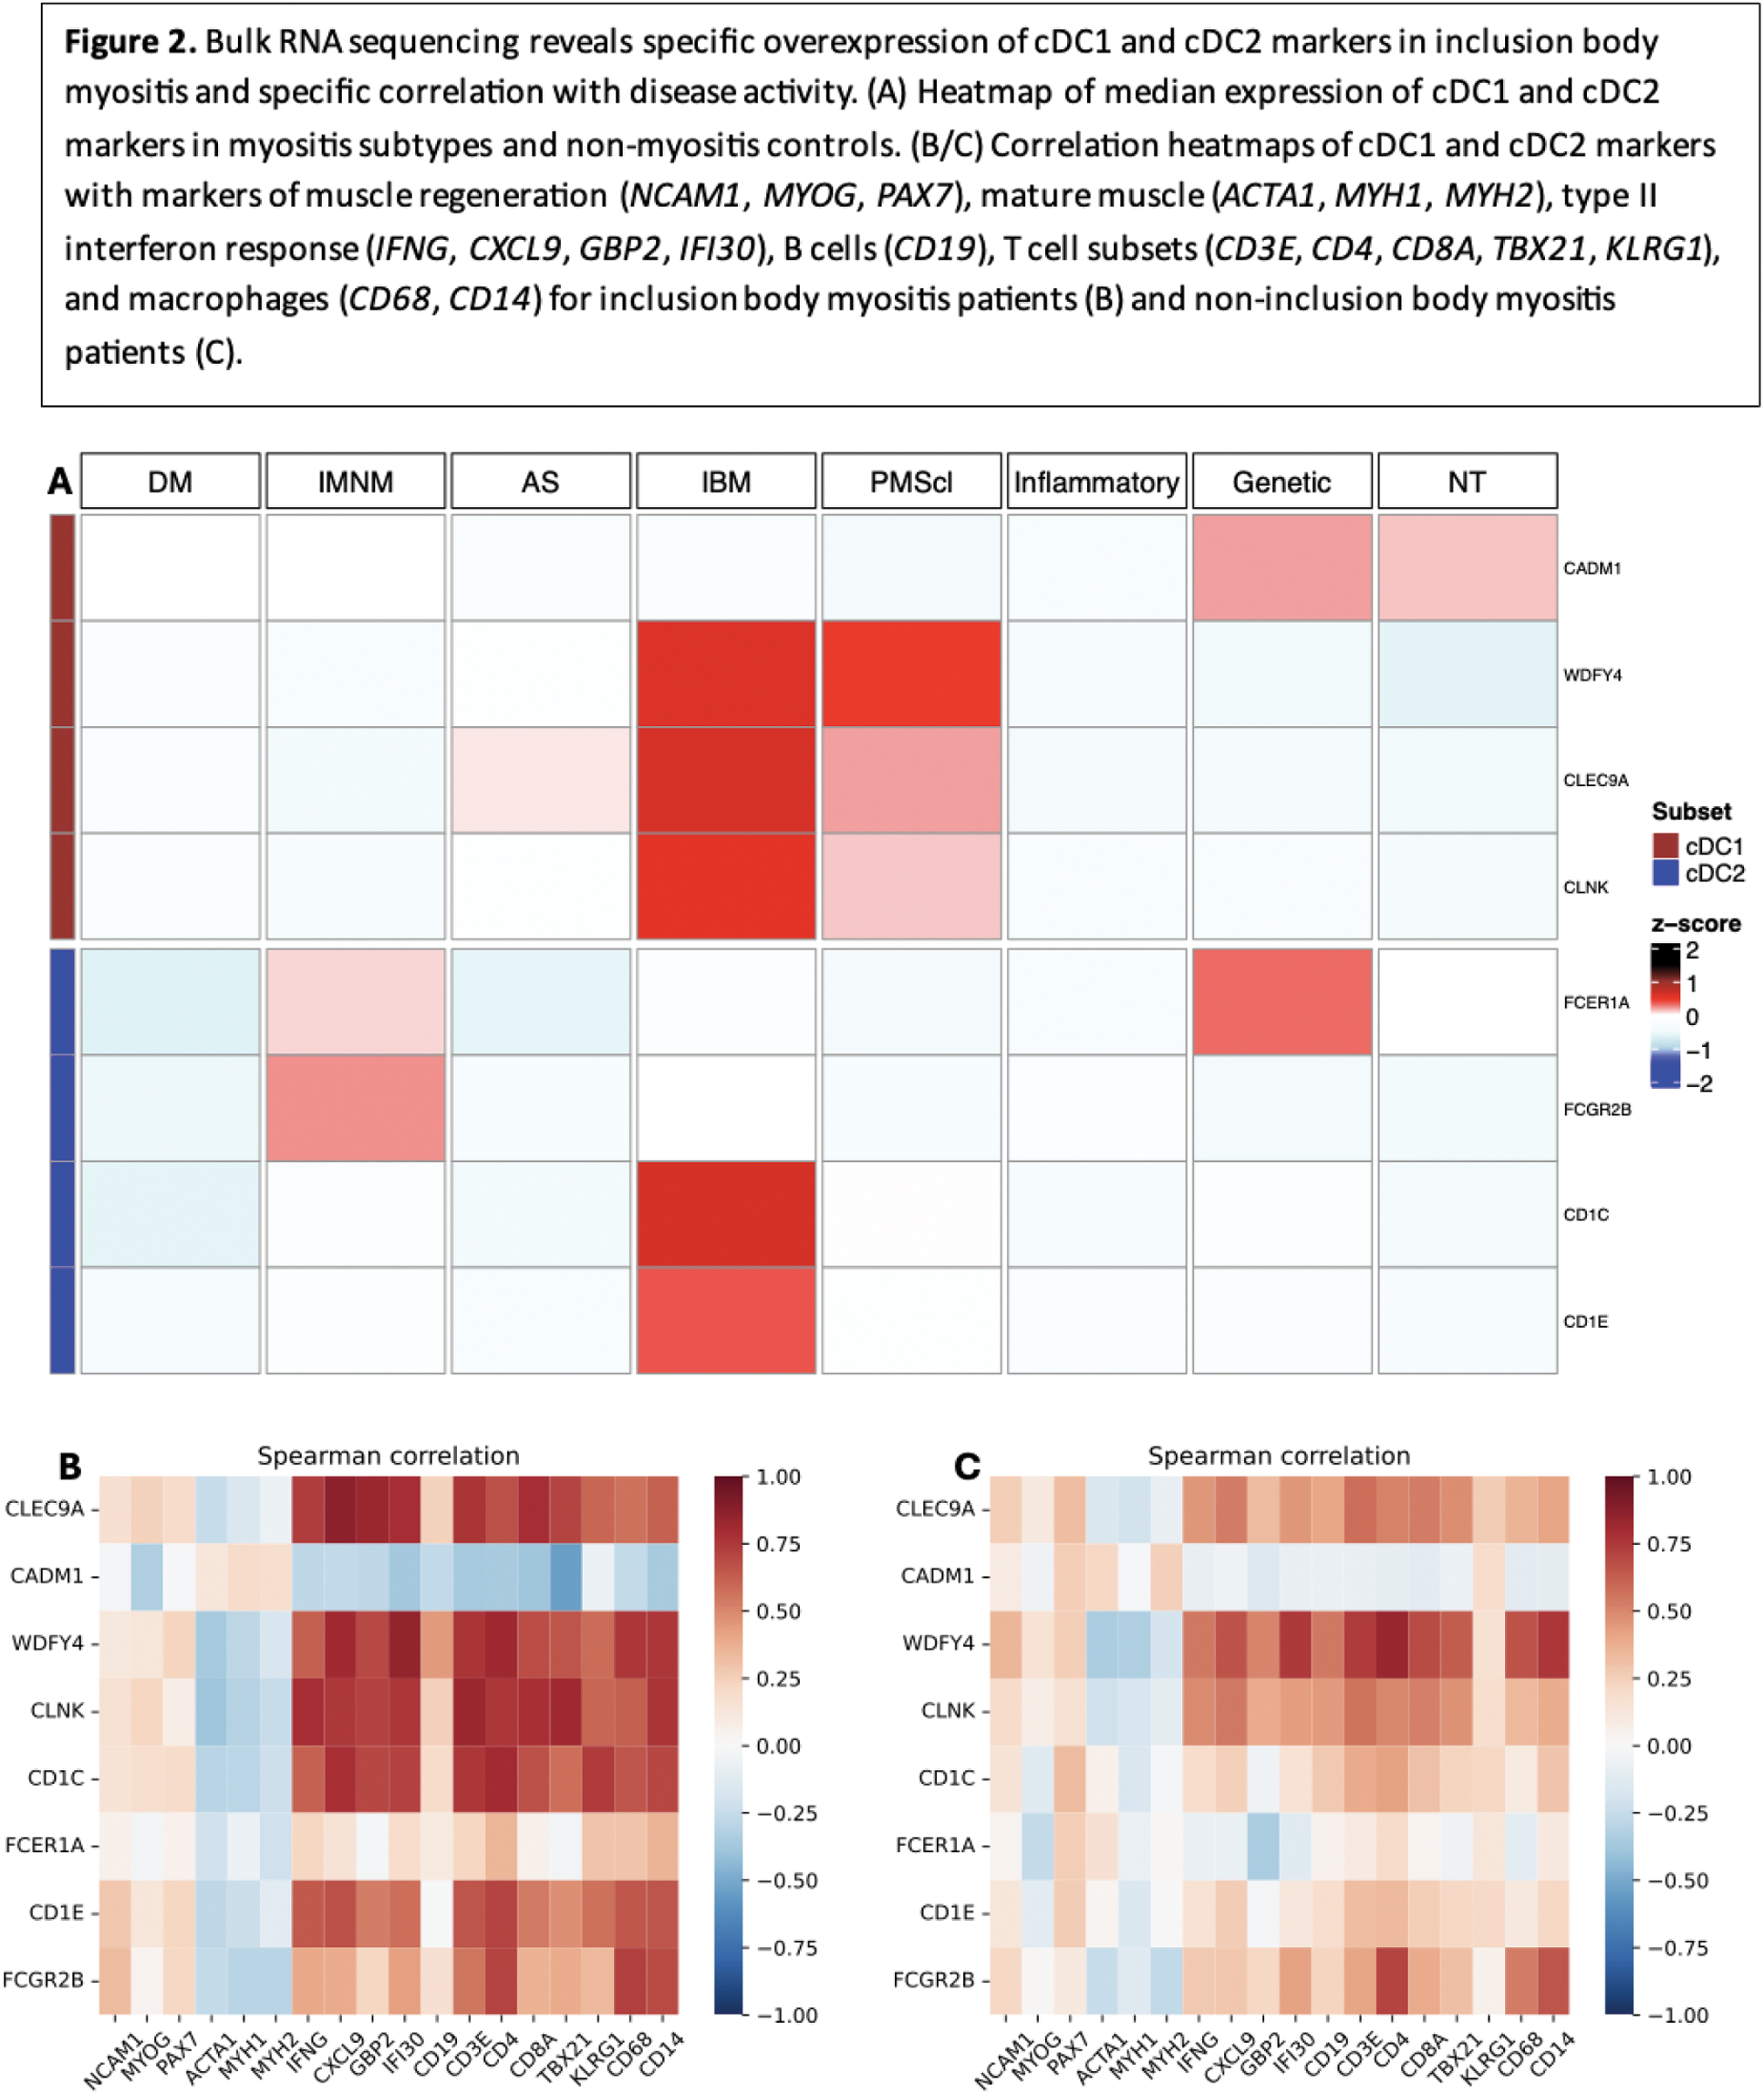
Results: Analysis of PCA from scRNA-seq data using the elbow method revealed 4 optimal components. UMAP clustering was performed on these 4 components, and clusters were subsequently labeled based on gene expression patterns (Figure 1A). The 139 cells in the myeloid cell cluster were isolated, counts were transformed, and PCA was performed, revealing 6 optimal components by elbow method. Subsequent UMAP clustering did not reveal any clusters but is represented in Figure 1B. cDC1 cells were manually defined as cells with an average normalized transformed expression >0.5 for four classic cDC1 markers ( CLEC9A , CADM1 , WDFY4 , CLNK ). cDC2 cells were manually defined as cells with an average normalized transformed expression >0.5 for two classic cDC2 markers ( CD1C , FCER1A ). This manual clustering revealed 10 cDC1 cells and 8 cDC2 cells (Figure 1B). For each, genes differentially overexpressed compared to myeloid cells and all cells (adjusted p-value <0.01) were identified, revealing 51 cDC1-specific markers and 4 cDC2-specific markers. For cDC1, these included the four genes used for selection, but also multiple other cDC1 markers, including DNASE1L3 , IDO1 , NET1 , CPNE3 , and ENPP1 [4]. For cDC2, the 4 markers included the two used for selection, as well as two other cDC2 markers ( CD1E and FCGR2B ) [4]. A dot plot of these genes among all clusters in our dataset is shown in Figure 1C, confirming cDC specificity. The 4 cDC2-specific markers as well as the 4 classic cDC1-specific markers were used for heatmap generation using RNA-seq data. Median expression of 3 of the 4 cDC1 markers ( CLEC9A , WDFY4 , CLNK ) and 2 of the 4 cDC2 markers ( CD1C , CD1E ) was notably higher in IBM patients than other groups (Figure 2A). The same markers also displayed markedly stronger correlations with markers of type II interferon response and markers of T cells and macrophages in IBM patients (Figure 2D) compared to non-IBM patients (Figure 2C).
Conclusion: Our analysis revealed the presence of two distinct populations of myeloid dendritic cells, cDC1 cells and cDC2 cells, in the muscle of IBM patients. From RNA-seq analysis, these cells seem to be specifically increased in IBM muscle compared to muscle of other myositis patients, and specifically correlated with markers of IBM disease activity, namely type II interferon response and CD8+ effector T cells, underlying their potential role in IBM pathogenesis.
REFERENCES: [1] Greenberg SA, Pinkus GS, Amato AA, Pinkus JL. Myeloid dendritic cells in inclusion-body myositis and polymyositis. Muscle Nerve . 2007;35(1):17-23. doi:10.1002/mus.20649.
[2] Tateyama M, Fujihara K, Misu T, Itoyama Y. CCR7+ myeloid dendritic cells together with CCR7+ T cells and CCR7+ macrophages invade CCL19+ nonnecrotic muscle fibers in inclusion body myositis. J Neurol Sci . 2009;279(1-2):47-52. doi:10.1016/j.jns.2008.12.024.
[3] Wischnewski S, Thäwel T, Ikenaga C, et al. Cell type mapping of inflammatory muscle diseases highlights selective myofiber vulnerability in inclusion body myositis. Nat Aging . 2024;4(7):969-983. doi:10.1038/s43587-024-00645-9.
[4] Villani AC, Satija R, Reynolds G, et al. Single-cell RNA-seq reveals new types of human blood dendritic cells, monocytes, and progenitors. Science . 2017;356(6335):eaah4573. doi:10.1126/science.aah4573.
Acknowledgements: Julie Thompson for her invaluable help maintaining the NIH Natural History Protocol, the NIAMS Sequencing Core, and its members.
Disclosure of Interests: None declared.
© The Authors 2025. This abstract is an open access article published in Annals of Rheumatic Diseases under the CC BY-NC-ND license (