fetching data ... 
Background: Fibromyalgia is a chronic disorder characterized by widespread pain and reduced quality of life, often linked to central sensitization (i.e., heightened pain sensitivity from amplified nerve signaling in the central nervous system). Diagnosis and treatment remain challenging, with patient responses to usual therapies, such as duloxetine hydrochloride, varying greatly and the underlying cause of the partly sufficient response remaining poorly understood. Stratification of fibromyalgia patients for precise, targeted treatments, along with the identification of clinically relevant biomarkers, remains an unmet need in fibromyalgia management. Metabolomics, representing the comprehensive analysis of the metabolic “fingerprint” unique to each individual at a given time, has emerged as a powerful approach for the investigation of the underlying mechanisms of complex diseases, as well as for monitoring treatment efficacy and disease activity. In fact, it has been applied in several inflammatory diseases including rheumatoid arthritis [1], large-vessel vasculitis [2,3], fatty liver disease [4], and diabetes [5]. Applications of metabolomics in fibromyalgia remain limited and have mainly focused on comparisons with healthy controls, highlighting metabolic alterations associated with the disease [6].
Objectives: To comparatively explore the metabolic profiles of fibromyalgia patients with treatment-refractory and treatment-responsive disease following first-line duloxetine therapy, aiming to identify potentially distinct metabolomics fingerprints that could underpin the development of diagnostic, prognostic, and treatment-response biomarkers.
Methods: An exploratory pilot study was conducted over ten consecutive, consenting patients, all fulfilling the 2016 ACR classification criteria for fibromyalgia without other underlying autoimmune or psychological diseases. All the enrolled patients were women with mean age at diagnosis 47.4 ± 10 years and were started on duloxetine hydrochloride (60 mg bid) as first-line treatment. Five patients had refractory fibromyalgia (non-responders), defined by persistent or worsening symptoms after six months of treatment, while the remaining five were considered in remission (responders), as they had achieved complete symptom resolution. Paired specimens of plasma and urine samples were collected under a standardized protocol and analyzed at two time points prior and six months after treatment initiation. Profiling was performed utilizing high-resolution 1H 1D Nuclear Magnetic Resonance (NMR) spectroscopy. Plasma data were normalized to total intensity while in urine analysis Probabilistic Quotient Normalization was used. Univariate and multivariate statistical tools were used to investigate significant alterations of the examined groups.
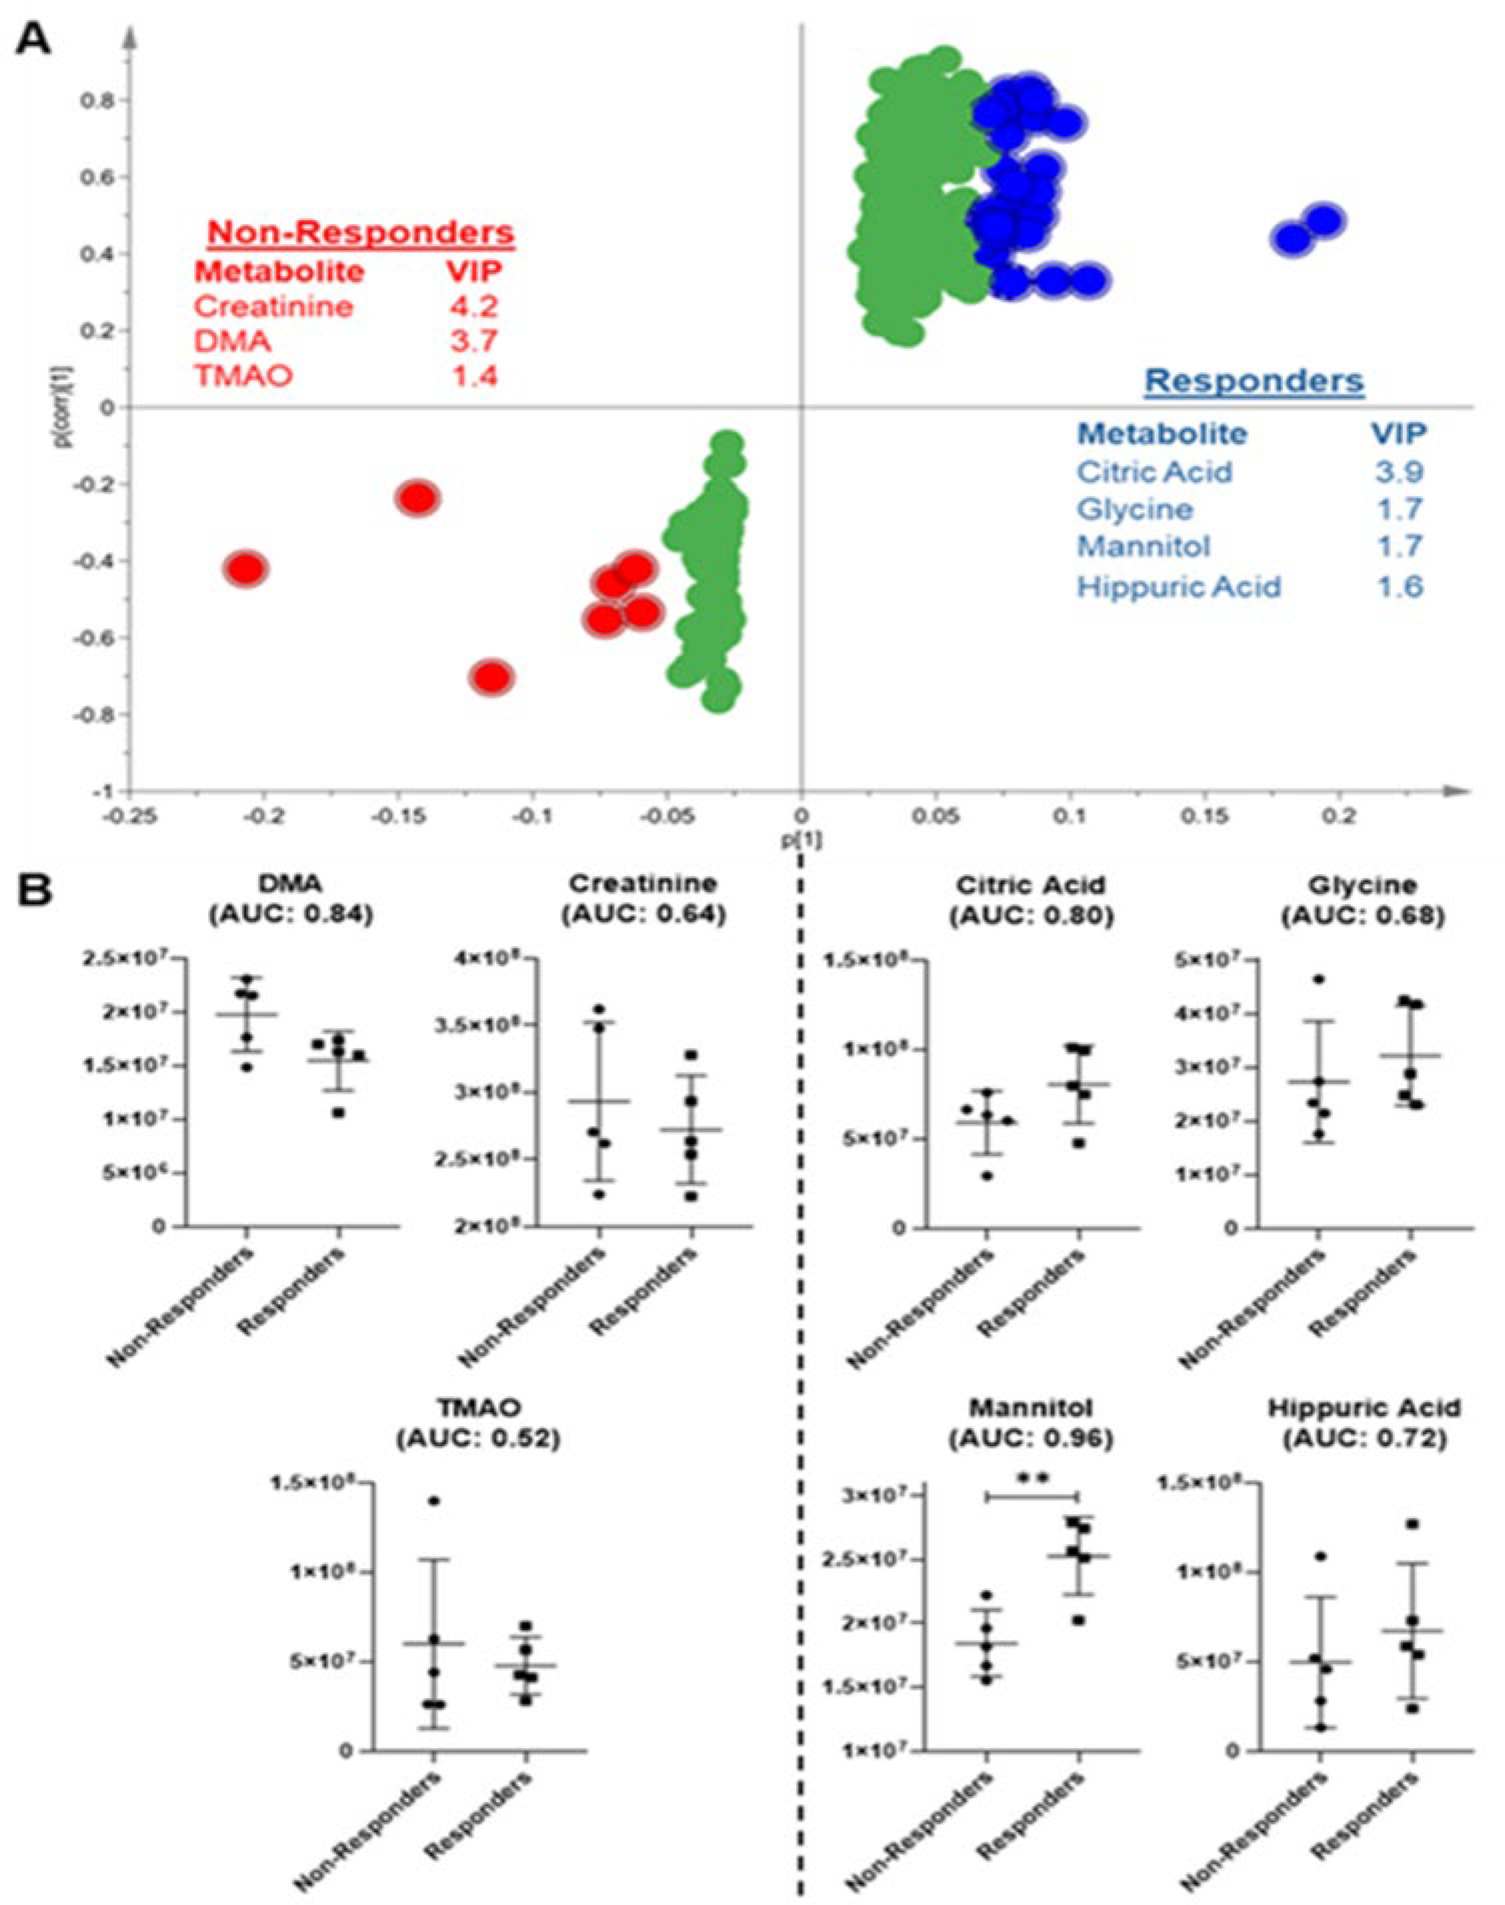
Results: In total, 61 metabolites were identified in urine specimens. Both unsupervised and supervised methods yielded models with low predictive ability and reliability, confirmed by permutation testing. Exploratory Orthogonal projection to latent structure discriminant analysis (OPLS-DA), focusing on spectroscopic variables with higher variable importance in projection scores (VIP >2), generated a valid model suggesting trends toward group separation (S-plot shown in Figure 1A). Patients with refractory disease exhibited increased urinary levels of creatinine, dimethylamine (DMA) and trimethylamine N-oxide (TMAO), whereas patients in remission manifested elevated urinary hippuric and citric acid, glycine and mannitol. Among these metabolites, only mannitol reached statistical significance in the univariate analysis. Nevertheless, ROC analysis performed for exploratory purposes, indicated moderate discriminative potential for DMA (AUC = 0.84) and citric acid (AUC = 0.80), while hippuric acid showed only marginal performance (AUC = 0.72) (Figure 1B). Interestingly, urea -excluded from the multivariate analysis- exhibited the highest discriminatory power (AUC = 0.92) and was significantly increased ( p = 0.019) in treatment-responsive patients. The concurrent elevation of urea and mannitol in responders may reflect higher protein intake, improved nitrogen balance, or altered catabolic state related to clinical improvement.
Profiling of plasma samples led to the identification of 27 distinct metabolites. Nevertheless, multivariate methods did not reveal any significant differences between the two groups, and supervised approaches also failed to generate statistically valid models.
Conclusions: In this exploratory study, urine-based metabolomic profiling suggested treatment-associated metabolic trends that differed between fibromyalgia patients with refractory and responsive disease. Large longitudinal studies are needed to clarify whether metabolomic signatures have prognostic value in fibromyalgia. Repeated metabolomics profiling over the course of treatment may help characterize metabolic shifts, and thus candidate biomarkers that correlate with clinical response. This approach could ultimately support patient stratification and guide the development of personalized therapeutic strategies in larger clinical trials.
A) S-plot of the OPLS-DA of urine samples from patients with fibromyalgia after 6 months of treatment and B) Box plots (mean with standard deviation) of urine metabolites responsible for group separation. AUC values are shown in parentheses.
REFERENCES: [1] Yousri NA, et al. Sci Rep. 2017
[2] Iliou A, et al Rheumatology (Oxford) 2023
[3] Jain A, et al. J Proteome Res. 2018
[4] Masoodi M, et al. Nat Rev Gastroenterol Hepatol. 2021
[5] Wang TJ, et al. Nat Med. 2011
[6] Malatji BG, et al. BMC Neurol. 2017
Acknowledgments: NIL.
Disclosure of Interests: None declared.