fetching data ... 
Background: Rheumatoid arthritis (RA) involves complex inflammatory pathways characterized by immune cell infiltration of synovial tissue and synovial fluid (SF). SF directly reflects local pathogenic mechanisms. Few studies have used multiplex or single-cell transcriptomic approaches to analyze its composition.
Objectives: The objectives were (1) to characterize the cytokine profile of SF from RA compared with other chronic inflammatory rheumatic diseases (CIRD) and osteoarthritis (OA), (2) to compare SF and serum within RA, and (3) to explore the transcriptomic signature of synovial fluid mononuclear cells (SFMC).
Methods: SF samples from 115 patients (45 RA, 48 CIRD, 22 OA) were analyzed using Luminex technology (21 cytokines including TNF-α, IL-1β, IL-6, IL-17, GM-CSF, IL-23, and CCL20). Paired serum samples were available for 29 patients with RA. Cytokine data were explored using heatmaps and unsupervised clustering. Single-cell RNA sequencing (scRNA-seq) was performed on SFMC from six patients with RA using the 10X Genomics Chromium platform and Cell Ranger.
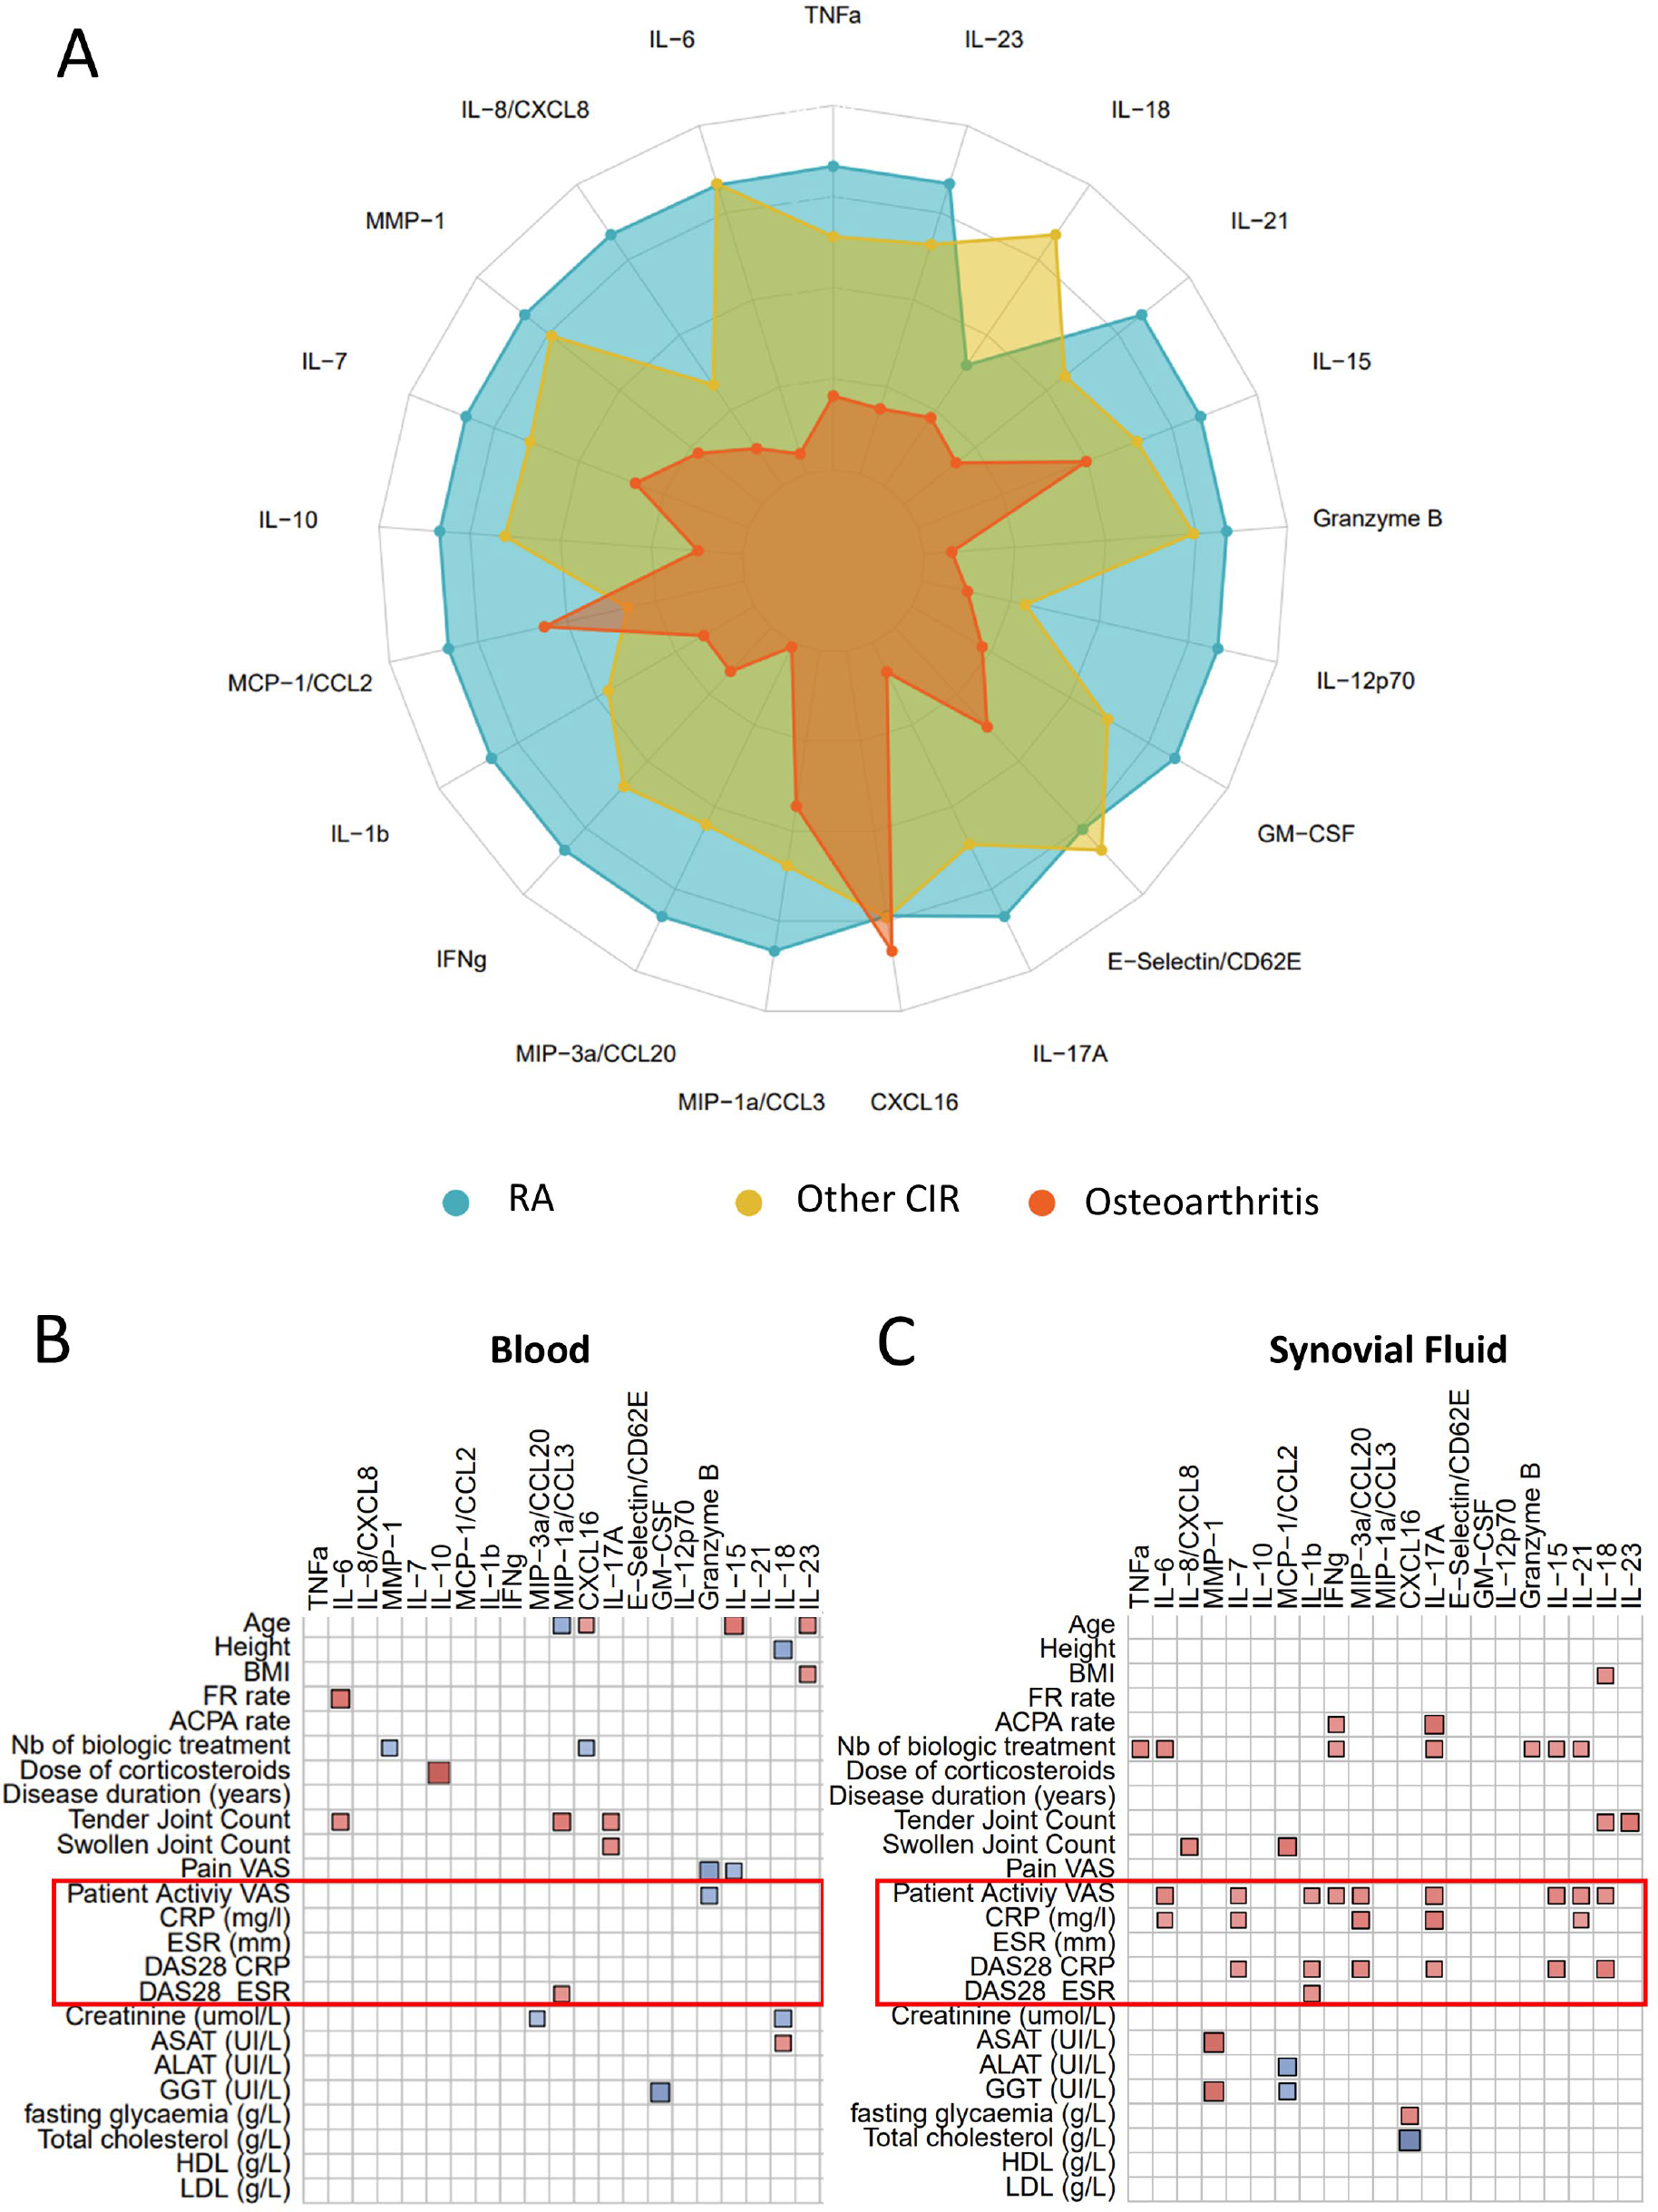
Results: RA SF exhibited significantly higher concentrations of pro-inflammatory cytokines (TNF-α, IL-1β, IL-6, IL-17, granzyme B, CCL20) than OA SF. IL-8, CCL2, and CCL3 were also increased compared to CIRD ( Figure 1A ). In RA, cytokine levels were higher in SF than in serum and correlated with CRP and DAS28-CRP, in contrast to serum cytokines ( Figure 1B–C ).
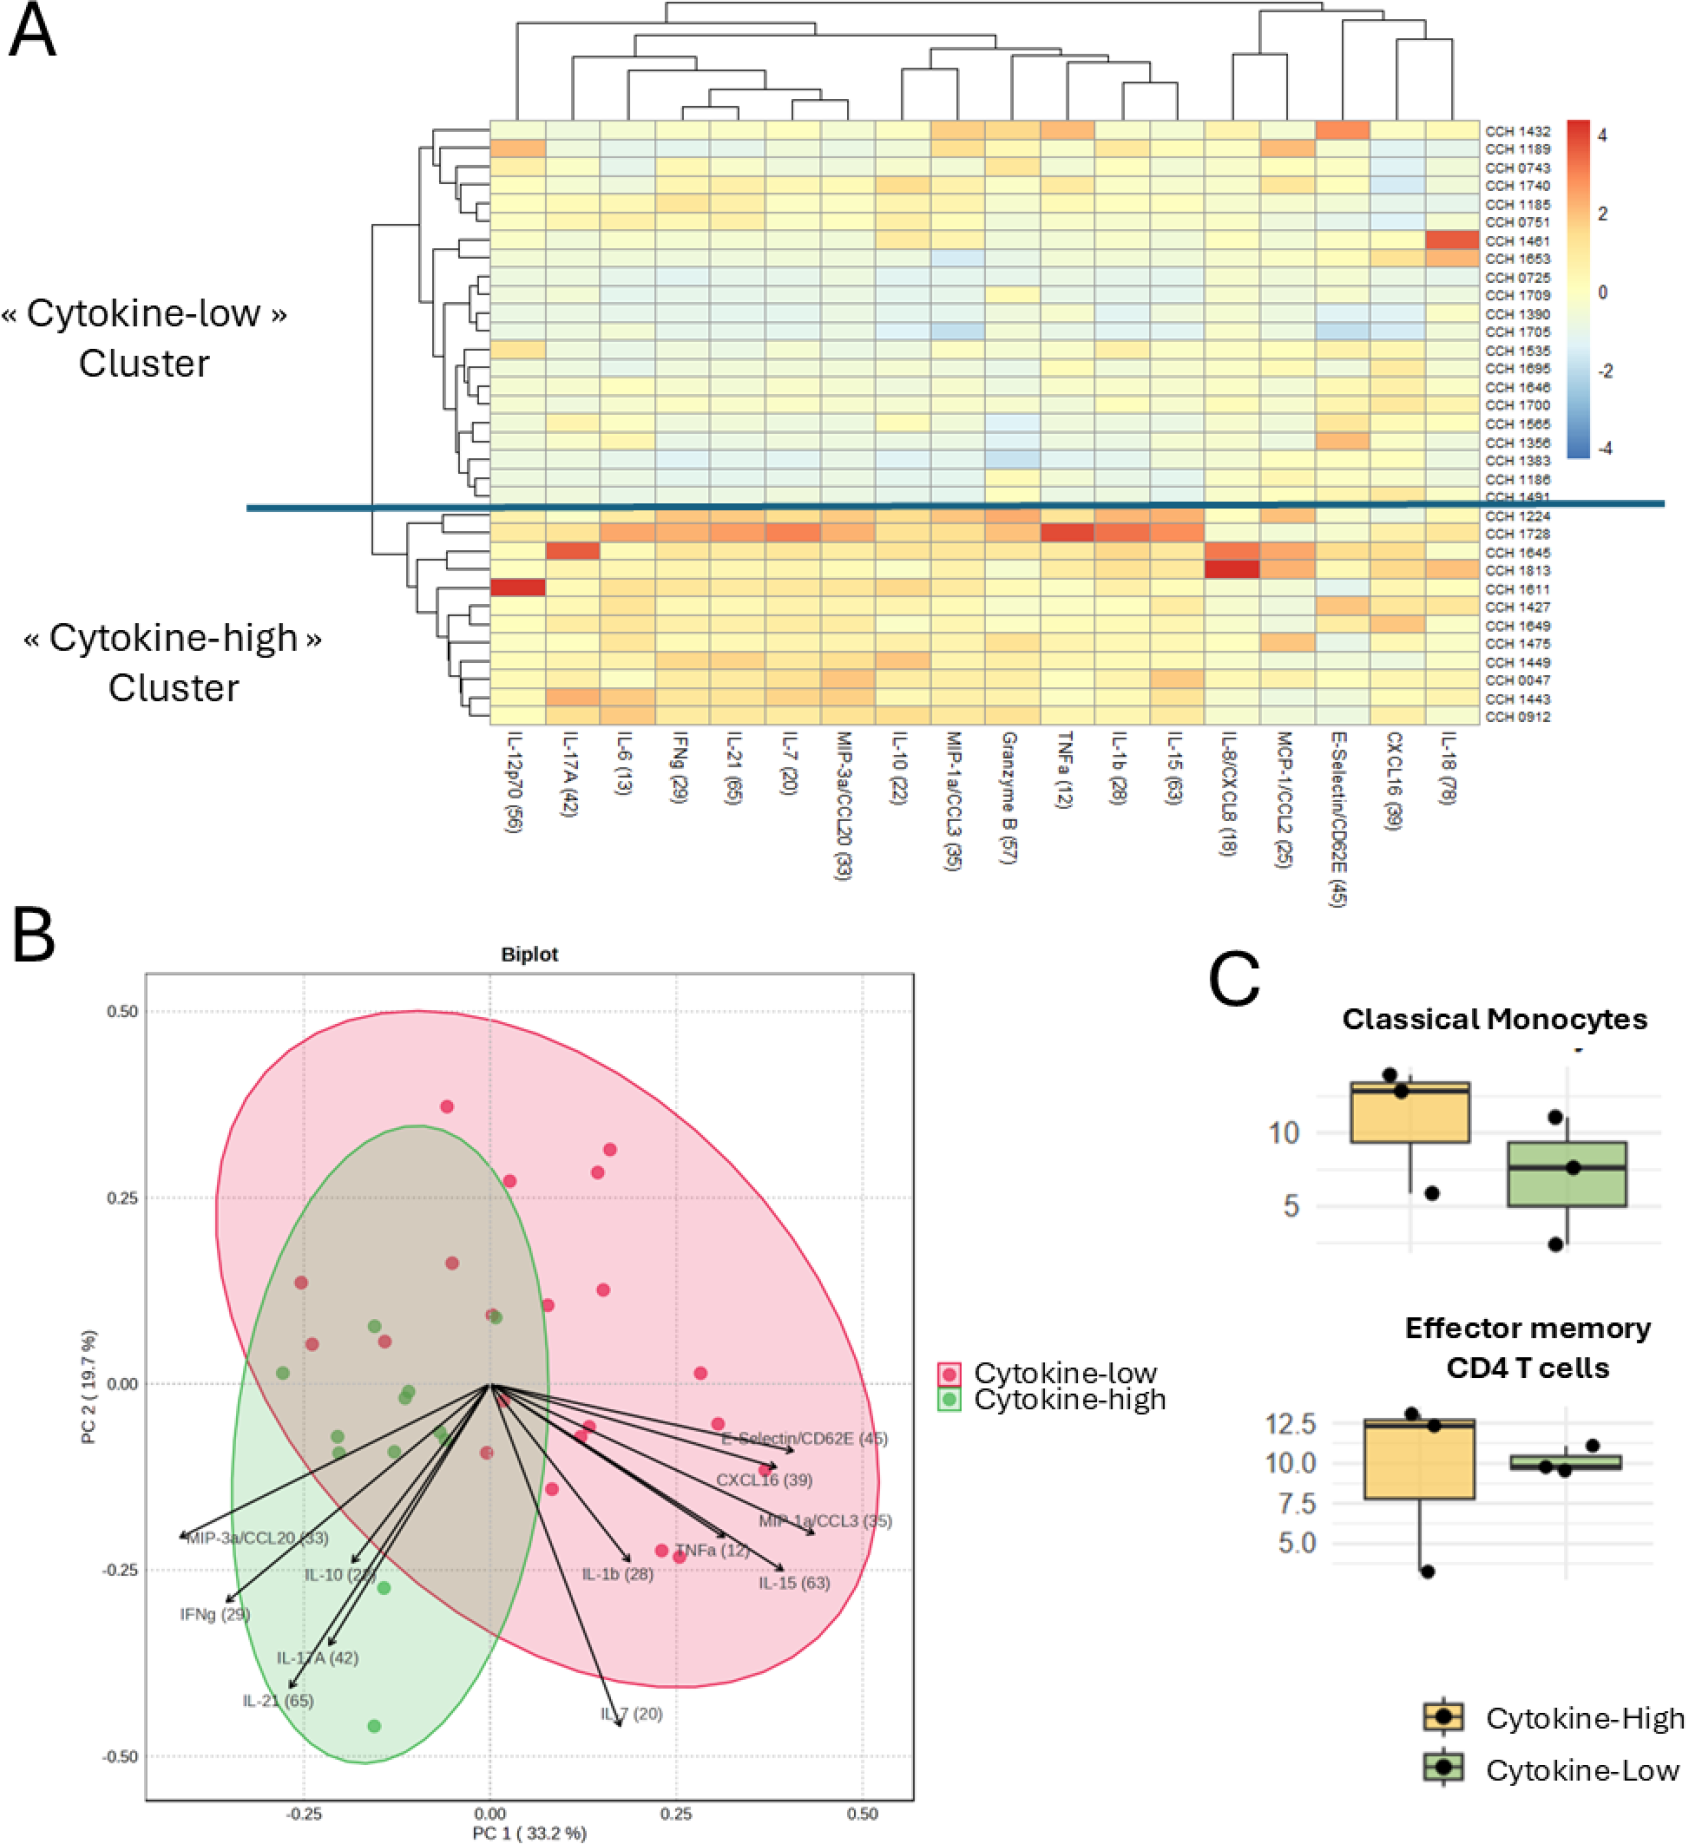
Heatmap analysis with unsupervised clustering identified two RA profiles: one characterized by high cytokine secretion, neutrophil-rich synovial cellularity, and elevated CRP (the “cytokine-high” cluster), and another with lower or moderate levels ( Figure 2A ). Among the 19 cytokines included in this analysis, 16 were increased in the “cytokine-high” cluster; however, five cytokines (IL-17A, IL-21, CCL20, IL-10, and IFN-γ) emerged as the main drivers of cluster separation ( Figure 2B ). scRNA-seq comparing three patients from the “cytokine-high” cluster and three from the “cytokine-low” cluster revealed a higher proportion of classical monocytes and effector memory CD4 T cells in the “cytokine-high” cluster ( Figure 2C ). Classical monocytes from the “cytokine-high” cluster showed transcriptional activation of innate immune pathways, particularly programs associated with neutrophil degranulation. Effector memory CD4 T cells displayed a signature suggestive of Th17 and regulatory T cell polarization, with production of IL-26 and chemokines promoting recruitment of additional immune cells and monocyte activation.
Conclusions: RA synovial fluid displays a compartmentalized immune response with two distinct profiles. In SF from patients in the “cytokine-high” cluster, classical monocytes may contribute to innate immune activation through neutrophil degranulation, while effector memory CD4 T cells appear polarized toward a Th17 phenotype producing IL-26 and chemokines that promote cellular recruitment and monocyte activation. These findings reveal a coordinated inflammatory network within the joint and highlight novel therapeutic avenues through an integrated cytokine and single-cell transcriptomic approach.
Cytokine profiles and correlations with clinical and biological parameters in RA. (A ) Radar plot illustrating the relative concentrations of 21 cytokines in synovial fluid (SF) from rheumatoid arthritis (RA, blue), other chronic inflammatory rheumatic diseases (CIR, yellow), and osteoarthritis (OA, orange). Each axis represents a specific cytokine, with values normalized to highlight differences between disease groups. (B ) Correlation matrix (corrplot) between cytokines measured in blood and various clinical and biological parameters in RA patients. (C ) Correlation matrix (corrplot) between cytokines measured in blood and various clinical and biological parameters in RA patients.
Analysis of cytokine and immune profiles in synovial fluid from patients with rheumatoid arthritis.
(A) Heatmap of relative concentrations of 19 cytokines measured in synovial fluid from patients with rheumatoid arthritis (RA). Unsupervised clustering identified two patient subgroups: a “cytokine-high” cluster (high cytokine concentrations, bottom) and a “cytokine-low” cluster (lower concentrations, top). Each row represents a patient, each column a cytokine, and color intensity reflects relative concentration (z-score scale).
(B) Principal component analysis (PCA, biplot) illustrating patient distribution according to cytokine profiles. Patients from the “cytokine-high” cluster (pink) and the “cytokine-low” cluster (green) are shown with their confidence ellipses. Black vectors indicate the contribution of cytokines to group separation, highlighting IL-17A, IL-21, CCL20, IL-10, and IFN-γ as major drivers.
(C) Relative proportions of selected immune cell populations derived from scRNA-seq comparing three patients from the “cytokine-high” cluster and three from the “cytokine-low” cluster. Boxplots show a trend toward increased classical monocytes (top) and effector memory CD4 T cells (bottom) in the “cytokine-high” cluster.
REFERENCES: NIL.
Acknowledgments: NIL.
Disclosure of Interests: None declared.