fetching data ... 
Background: Targeting remission has long been the ultimate goal in the management of patients with Systemic Lupus Erythematosus (SLE) whenever possible, but is challenging to achieve. The development of the Lupus Low Disease Activity State (LLDAS) has been defined as more realistic and attainable objective that shares similar outcomes to remission in terms of reducing mortality, morbidity and damage. However, the biological profile of LLDAS and whether it represents a distinct state from both active disease and remission has not been fully characterized.
Objectives: To define the proteomic profile of patients with SLE in LLDAS in comparison to those in remission and those with active disease.
Methods: We analysed serum samples of 126 patients with SLE as defined using the American College of Rheumatology 1997 criteria. Disease activity was assessed using the Systemic Lupus Erythematosus Disease Activity Index 2000 (SLEDAI-2K). LLDAS and Clinical Definition Of Remission in SLE (DORIS) were defined as per previously published criteria except that Physician Global scores were not included. Active SLE was defined as a clinical SLEDAI-2K > 4 or on a prednisolone dose > 7.5 mg/day. Proteomic analysis was performed using the Nucleic acid Linked Immuno-Sandwich Assay (NULISA) Inflammation Panel 250 (Alamar). The assay enables quantification of 250 inflammation protein using a dual capture-release mechanism on a liquid biopsy platform that is considerably more sensitive than standard assays, able to detect concentrations below 0.01pg/ml. The samples were assayed at Alamar Biosciences. Outcomes were analysed on RStudio (V4.5.2) in two steps: First, we compared the protein expression between the Active group and the Remission group, then we incorporated the data from LLDAS group to position its proteomic profile relative to the Active group and the Remission group respectively. Protein expression values were compared between Active and Remission groups using unpaired two-sample t-tests for each marker with Welch’s correction for unequal variances. P-values were adjusted for multiple comparisons using the Benjamini-Hochberg method to control the False Discovery Rate (FDR). Pathway enrichment analysis was performed on differentially expressed proteins to identify biologically relevant pathways associated with disease activity. Patient clustering was visualised using unsupervised hierarchical clustering heatmaps of proteins identified to have the highest discriminative potential (p-adjusted<0.03), with values standardised per protein (z-scores) and capped at ± 6 to limit the influence of extreme values for visualisation purposes; clinical groups were overlaid as colour-coded annotations. Group- wise distributions were displayed using boxplots with pairwise comparisons across disease states with a level of significance at 5%.
Results: Our cohort included 118 females and 8 males. Median age was 43.5 years old [16 – 67]. Seventeen patients were defined as being active, 14 were in LLDAS and 95 were in Clinical remission. The first step was to identify the main markers that differentiate the active group from the remission group; Fifteen markers were significantly elevated, indicating an enriched activity of the following pathways in the active group: (1) Inflammation-amplification: TREM1, IL18, IL18BP; (2) Leucocyte recruitment/vascular activation: SELE, CX3CL1, CCL25; (3) Antigen presentation/conditioning maturation: CD83, LAMP3; (4) Inhibitory/checkpoint: LILRB2, SRPA, LGALS9, TREM2; (5) Tissue remodelling: MMP3.
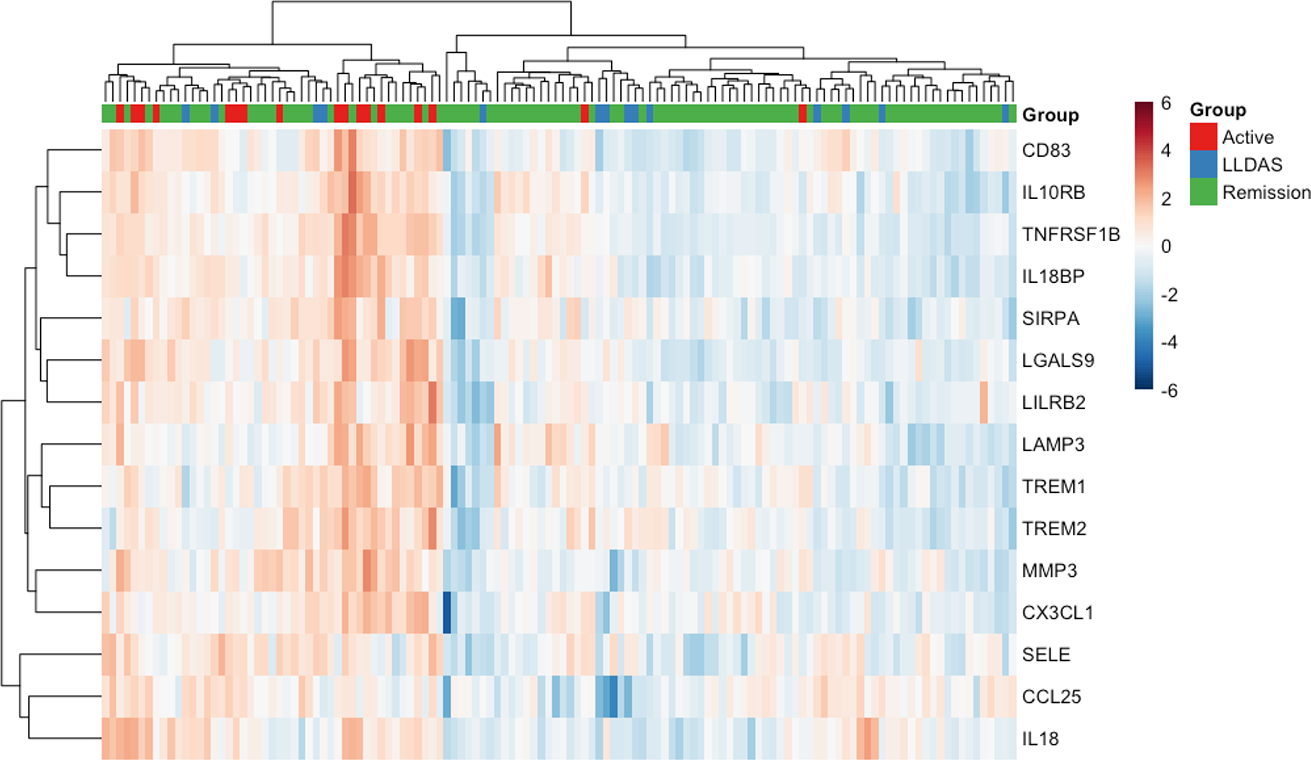
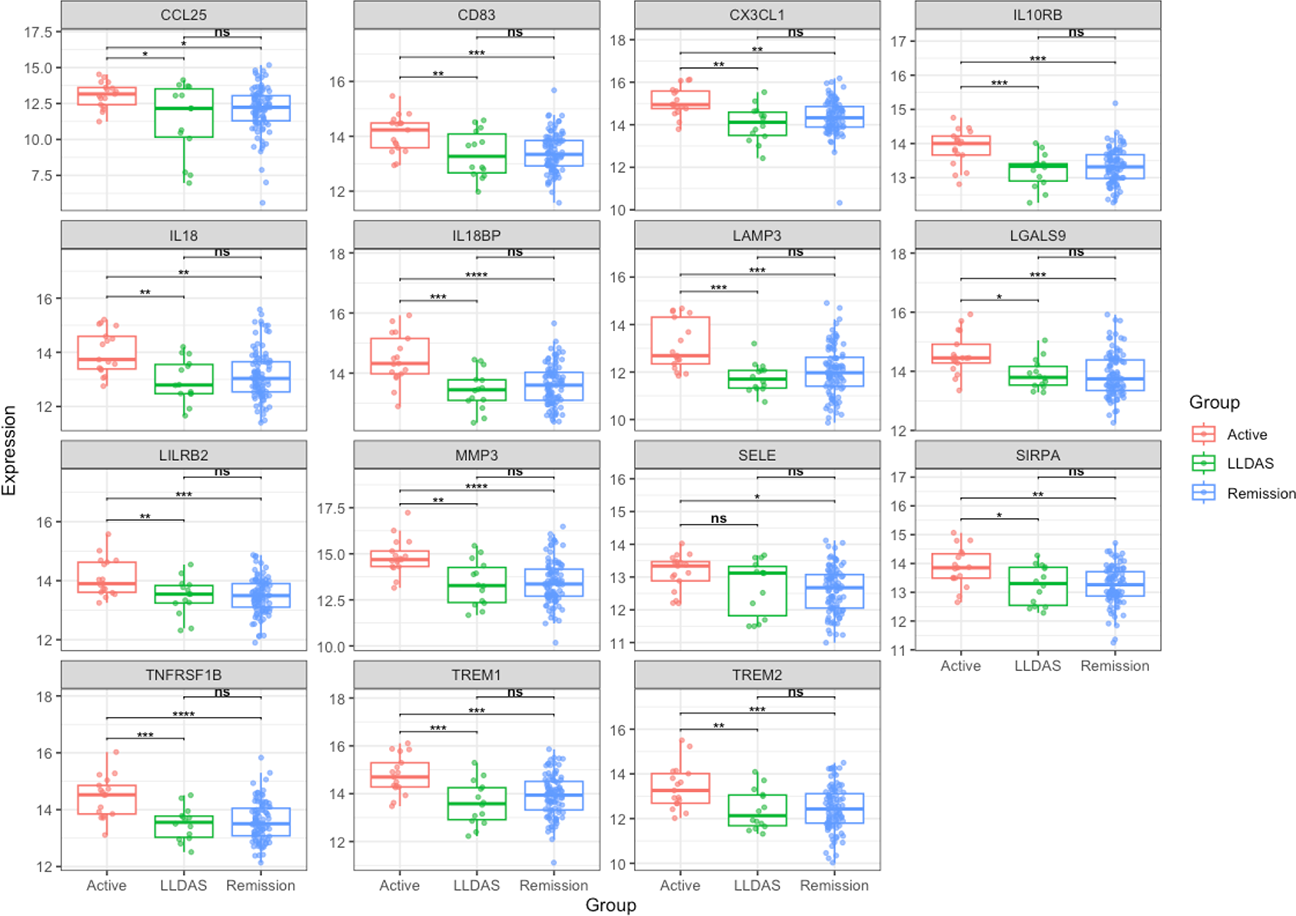
Inserting the proteomic data profile of the LLDAS group focusing on these 15 active-disease markers (Figure 1, unsupervised heatmap) demonstrated the markers with discriminative potential between remission and active groups were unable to separate LLDAS from remission. Consistently, there were no significant differences between the LLDAS and DORIS remission group across all fifteen markers. In stark contrast, comparison between LLDAS and the active group detected significant differences in all markers except for SELE. Therefore, the same biological pathways distinguishing active disease from remission also distinguished active disease from LLDAS, whereas LLDAS and remission were proteomically similar. Pair-wise comparisons across the 3 disease activity states are summarised in Figure 2.
Conclusions: In this cohort, LLDAS showed a proteomic profile indistinguishable from clinical remission but remained distinct from active disease. These results support the biological plausibility of LLDAS as a clinically meaningful treatment target and may explain why LLDAS and remission are associated with similar long-term outcomes.
Adding more longitudinal data and stratifying patients using current medication and serological activity may give more insight and help better understand remission and LLDAS in SLE.
Heatmap comparing inflammatory markers in SLE patients in different disease activity states.
Values standardised per protein using z-scores.
LLDAS: Lupus low disease activity state
Boxplots comparing inflammatory markers between the active, remission and LLDAS groups
LLDAS: Lupus low disease activity state; ns: non-significant; *: p<0.05; **: p<0.01; ***: p<0.001; ****: p<0.0001
REFERENCES: NIL.
Acknowledgments: NIL.
Disclosure of Interests: None declared.