fetching data ... 
Background: Bone mineral density (BMD) is central to fracture risk assessment in post-menopausal women, yet many fragility fractures occur above the osteoporosis threshold, implying additional contributors beyond BMD. Socioeconomic deprivation has also been associated with fracture risk independent of BMD in UK populations. However, real-world DXA studies rarely compare BMD sites despite evidence that fracture risk estimates vary by skeletal site, while jointly adjusting for traditional clinical risk predictors, lifestyle, body composition and deprivation within a single adjusted model, limiting clinically interpretable risk estimates. We therefore evaluated the performance of traditional predictors (as used in FRAX where available) alongside BMD site comparisons and reported model calibration.
Objectives: To evaluate associations and model performance of traditional clinical predictors for prevalent fragility fracture in post-menopausal women undergoing DXA, including socioeconomic deprivation, comparing models using lumbar spine, femoral neck and total hip BMD.
Methods: Retrospective observational cohort of post-menopausal women referred for DXA across Lancashire Teaching Hospitals NHS Foundation Trust and University Hospitals of Morecambe Bay NHS Foundation Trust (June 2014-October 2024). Outcome was prevalent fragility fracture (yes/no), identified from DXA referral/clinic documentation and medical records at the DXA visit. Pre-specified predictors included traditional clinical risk factors used in FRAX where available (age, BMI, rheumatoid arthritis, current smoking, excess alcohol >14 units/week), plus years since menopause, DXA % body fat and UK Index of Multiple Deprivation (IMD) quintiles (Q1 most deprived to Q5 least deprived; Q5 reference). The primary model used L1-L4 mean BMD; parallel models substituted femoral neck or total hip BMD. BMD effects are reported per SD decrease. Discrimination was assessed using AUROC and calibration using Hosmer-Lemeshow and calibration slope/intercept; sensitivity analysis modelled IMD decile as an ordinal trend (p-trend). Complete-case analysis across covariates yielded n=3,764 in the primary model. Research ethics approval was obtained for analysis of anonymised routinely collected NHS DXA service data.
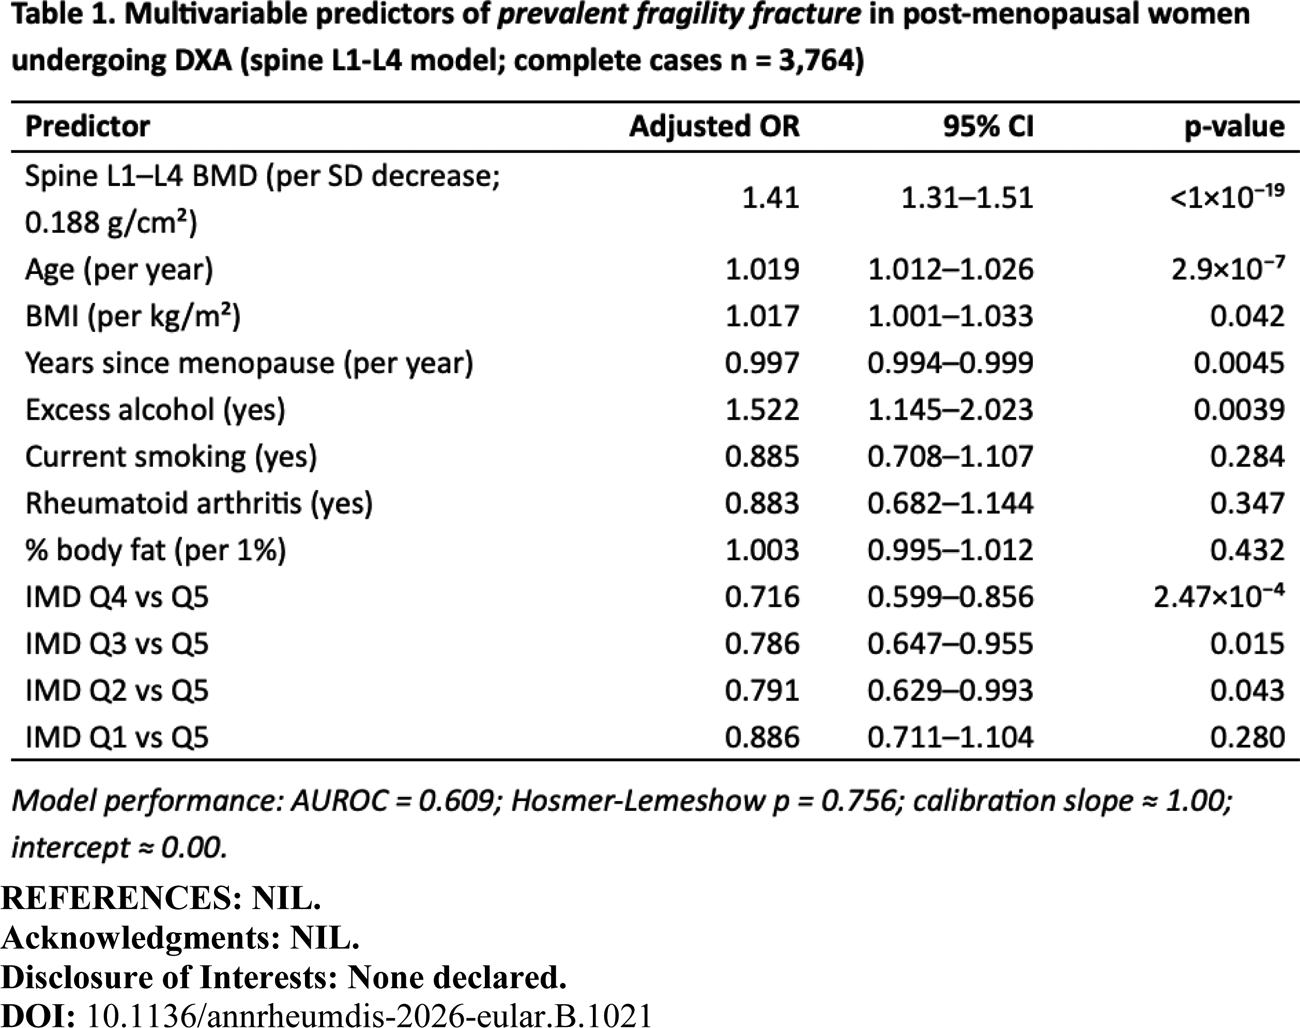
Results: Across June 2014-October 2024, 4,078 women underwent DXA; the prevalent fracture proportion was 46.7%. Fracture cases were older (+1.29 years, p=3.4×10 −5 ) and had lower spine, femoral neck and total hip BMD (all p<10 −17 ). Univariate (fracture vs no fracture): excess alcohol was more frequent (OR 1.41, p=0.016), while smoking showed an inverse association (OR 0.80, p=0.032). Multivariable (primary spine model; complete cases n=3,764): spine BMD per SD decrease was independently associated with prevalent fragility fracture (aOR 1.41, 95% CI 1.31–1.51; p<1×10 −19 ) (Table 1). Age (aOR 1.019/year; p=2.9×10 −7 ), BMI (aOR 1.017/kg/m 2 ; p=0.042) and excess alcohol (>14 units/week; aOR 1.52; p=0.0039) remained associated after adjustment; smoking, rheumatoid arthritis and DXA % body fat were not (p>0.05). IMD quintiles showed adjusted associations without an ordinal gradient (p-trend 0.94). IMD associations were non-linear and may reflect referral or recording patterns within a DXA service cohort. Discrimination was modest (AUROC 0.609) with acceptable calibration (Hosmer-Lemeshow p=0.756; slope≈1; intercept≈0). Findings were consistent for femoral neck and total hip models (per SD decrease ORs ~1.40-1.47; AUROC 0.607-0.611).
Conclusions: In an NHS DXA service cohort, BMD was the strongest independent predictor of prevalent fragility fracture, with additional independent associations for age, BMI and excess alcohol. Traditional clinical predictors available in routine DXA referral data showed modest discrimination but acceptable calibration, supporting contextualisation of DXA interpretation using key clinical and socioeconomic variables when evaluating documented fracture history in referrals. Prospective validation using incident fractures is warranted to evaluate incremental predictive value beyond BMD.
REFERENCES: NIL.
Acknowledgments: NIL.
Disclosure of Interests: None declared.