fetching data ... 
Background: The bony changes of osteophyte growth and bone attrition (broadening and flattening) associated with OA have been recognized in radiographs for many years. Recently, the development of automated measurement of a z-score of 3D knee femoral bone shape (B-score) from MR or CT images has demonstrated that bone shape provides a continuous measure of OA status, predicts future OA onset, and is associated with patient-important endpoints such as pain, loss of function and joint replacement [1]. It has been postulated that OA bony changes are in part a response to local inflammation. Osteophytes develop at the edge of the synovial attachment and are known to be mediated by macrophages, so the association between inflammation and bone shape progression shown here may indicate that they are part of an inflammatory response.
Objectives: We aimed to explore the association between baseline MOAKS effusion-synovitis scores, and the rate of B-score bone shape change in knee OA.
Methods: B-scores were automatically derived from Osteoarthritis Initiative (OAI) DESS MR images of all knees included in the FNIH OA Biomarkers Consortium sub cohort at baseline, 1, and 2-year timepoints. B-score annual rates of change (slopes) were modelled by linear least-squares (LLM) regression over 2 years. MRI images were scored for effusion-synovitis from 0-3 using the semi-quantitative MRI Osteoarthritis Knee Score (MOAKS) and TSE MR images. Associations between baseline effusion-synovitis and B-score slopes were explored using box plots and Kendall’s rank correlation coefficient (tau). Statistical significance of differences between successive MOAKS scores of mean baseline B-scores and mean annual B-score rates were tested using unpaired two-sided t-tests.
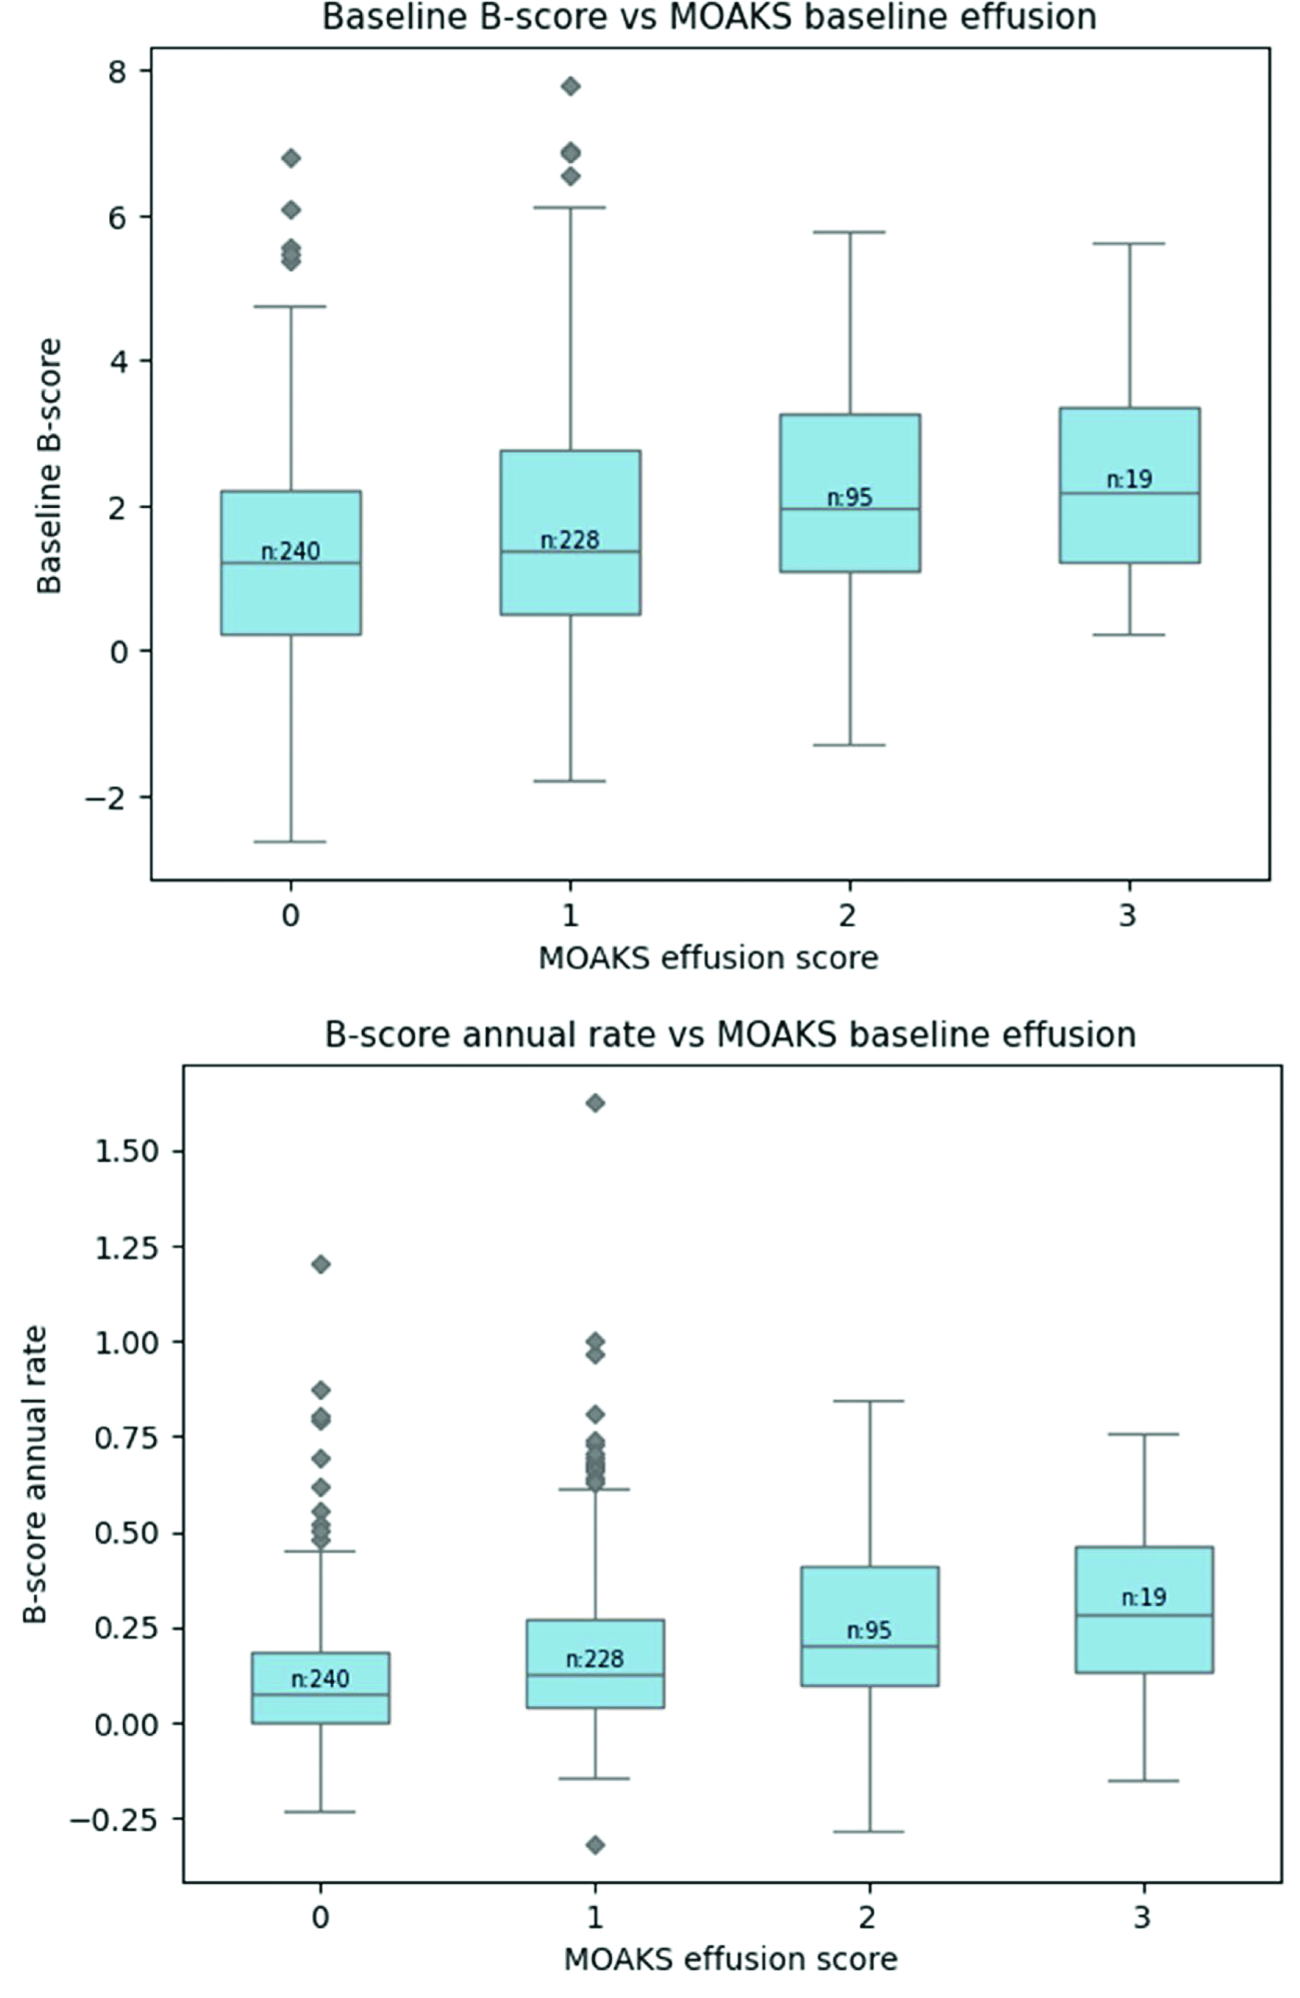
Results: The analysis set comprised 582 knees (59% female, KLG1: 12%, KLG2: 51%, KLG3: 37%) with MR images available at all three timepoints. Mean baseline MOAKS effusion-synovitis score was 0.86 (range 0-3), mean (SD) B-score was 1.68 (1.69) and mean (SD) B-score annual rate of change was 0.17 (0.22). Mean baseline B-scores and mean B-score annual rates of change are shown in Table 1. Box plots of the MOAKS scores vs baseline b-scores are shown in Figure 1 and MOAKS scores vs mean B-score rate of change are shown in Figure 2. Kendall’s tau coefficient for baseline B-scores was 0.15 (p < 0.0001) and for B-score slope was 0.21 (p < 0.0001).
Conclusions: The B-score annual rates of change were moderately correlated with baseline MOAKS effusion-synovitis, though the baseline B-score values showed a weaker correlation. Both correlations were highly significant. Higher baseline MOAKS effusion-synovitis scores were associated with both higher baseline B-scores and higher rates of change, indicating a possible contribution of local inflammation to rate of knee bone shape change.
Mean baseline B-scores and mean B-score annual rates of change for different MOAKS baseline effusion-synovitis scores. Significance of differences of means between successive MOAKS scores: *p<0.05, **p<0.005, ***p<0.0005.
| Baseline MOAKS effusion score | N | Mean baseline B-score (SD) | Mean B-score rate per annum (SD) |
|---|---|---|---|
| 0 | 228 | 1.32 (1.56) | 0.12 (0.18) |
| 1 | 240 | 1.76 (1.80)** | 0.18 (0.22)*** |
| 2 | 95 | 2.19 (1.56)* | 0.26 (0.24)** |
| 3 | 19 | 2.44 (1.58) | 0.30 (0.26) |
Mean baseline B-score (top) and Mean 2-year B-score LLM slopes (bottom) for different MOAKS baseline effusion-synovitis scores.
REFERENCES: [1] Bowes et al. (2021) ARD 80(4) 502-508.
Acknowledgments: NIL.
Disclosure of Interests: Alan Brett: None declared, Philip G. Conaghan AbbVie, Janssen, Novartis, Sandoz, Alfasigma, Eli Lilly, Eupraxia, Formation Bio, Genascence, GSK, Grunenthal, Janssen, Kolon TissueGene, Levicept, Medipost, Moebius, Novartis, Stryker & Takeda.