fetching data ... 
Background: Daytime napping is a common lifestyle, with a global prevalence ranging from 20-60%. Although it can facilitate musculoskeletal recovery and enhance sports performance, it may affect cortisol secretion and sympathetic nervous system activity, possibly impairing skeletal muscle function.
Objectives: We evaluated the associations between daytime napping and skeletal muscle health.
Methods: Adults aged≥50 years from the Xiangya Sarcopenia Study, and participants who underwent musculoskeletal assessment and self-reported napping evaluation from the UK Biobank, respectively, were included. We examined the associations between daytime napping and ageing-related musculoskeletal indices, including grip strength, gait speed and appendicular lean mass using mixed-effects regression models. Additionally, we assessed potential causal effects of genetically-proxied napping frequency on musculoskeletal indices using Mendelian randomization (MR) analyses.
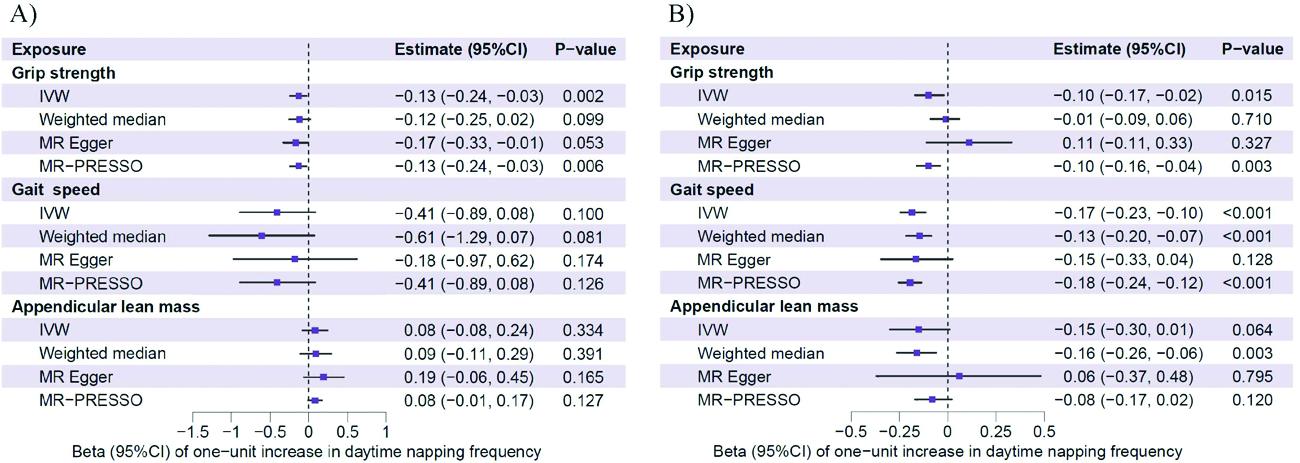
Results: In 2,377 participants from the Xiangya Sarcopenia Study, sometimes or usual daytime napping was associated with a lower grip strength (β=-0.36kg, 95%CI:-0.89~0.14 and -1.18kg, 95%CI:-2.41~0.05, respectively, P for trend =0.012), a higher odds of slow gait speed (OR=1.24, 95%CI:0.79~1.97 and 3.31, 95%CI:1.20~9.14, respectively, P for trend =0.017), but not appendicular lean mass (β=-0.05kg, 95%CI:-0.33~0.22 and 0.07kg, 95%CI:-0.62~0.76, respectively, P for trend =0.862), than no napping. Similar findings were observed in the UK Biobank (n=59,478). In both studies, increased genetically-proxied napping frequency was associated with decreased grip strength (β=-0.13kg, 95%CI:-0.24~-0.03 and -0.10kg, 95%CI:-0.17~-0.02) and gait speed (β=-0.41, 95%CI:-0.89~0.08 and -0.17, 95%CI:-0.23~-0.10).
Conclusions: Daytime napping is associated with lower grip strength and gait speed. These findings provide evidence that daytime napping may contribute to skeletal muscle degeneration. Reducing daytime napping frequency holds promise for preserving skeletal muscle health.
Mendelian randomization results for the relationship of daytime napping with skeletal muscle indices in one-sample MR from the Xiangya Sarcopenia Study (A) and two-sample MR from the 23andMe and the UK Biobank (B). MR, mendelian randomization; CI, confidence interval; IVW, inverse-variance weighted; MR-PRESSO, MR pleiotropy residual sum and outlier.
Associations of daytime napping with skeletal muscle indices in Xiangya Sarcopenia Study and UK Biobank Study
| Skeletal muscle indices | Daytime napping frequency | P for trend | ||
|---|---|---|---|---|
| Never/rarely | Sometimes | Usually | ||
| Xiangya Sarcopenia Study, n | 1,814 | 499 | 64 | |
| Grip strength | ||||
| Crude β (95%CI) | 0.0 (reference) | -0.29 (-1.07, 0.49) | -1.76 (-3.71, 0.20) | 0.114 |
| Adjusted β a (95%CI) | 0.0 (reference) | -0.36 (-0.89, 0.14) | -1.18 (-2.41, 0.05) | 0.012 |
| Slow gait speed | ||||
| Crude OR (95%CI) | 1.0 (reference) | 1.21 (0.63, 2.36) | 3.28 (0.76, 14.13) | 0.169 |
| Adjusted OR a (95%CI) | 1.0 (reference) | 1.24 (0.79, 1.97) | 3.31 (1.20, 9.14) * | 0.017 |
| Appendicular lean mass b | ||||
| Crude β (95%CI) | 0.0 (reference) | 0.02 (-0.32, 0.35) | 0.37 (-0.47, 1.21) | 0.561 |
| Adjusted β a (95%CI) | 0.0 (reference) | -0.05 (-0.33, 0.22) | 0.07 (-0.62, 0.76) | 0.862 |
| UK Biobank Study, n | 35,886 | 21,046 | 2,546 | |
| Grip strength | 0.0 (reference) | -1.17 (-1.29, -1.05) * | -2.24 (-2.52, -1.95) * | <0.001 |
| Crude β (95%CI) | 0.0 (reference) | -0.52 (-0.63, -0.41) * | -1.03 (-1.28, -0.78) * | <0.001 |
| Adjusted β a (95%CI) | ||||
| Appendicular lean mass | 0.0 (reference) | 0.32 (0.26, 0.37) * | 0.50 (0.38, 0.63) * | <0.001 |
| Crude β (95%CI) | 0.0 (reference) | -0.02 (-0.05, 0.02) | -0.10 (-0.18, -0.02) * | 0.047 |
| Adjusted β a (95%CI) | ||||
| Slow gait speed | 1.0 (reference) | 1.83 (1.48, 2.27) * | 4.08 (2.83, 5.89) * | <0.001 |
| Crude OR (95%CI) | 1.0 (reference) | 2.69 (2.23, 3.25) * | 6.23 (4.59, 8.63) * | <0.001 |
| Adjusted OR a (95%CI) | 0.0 (reference) | -1.17 (-1.29, -1.05) * | -2.24 (-2.52, -1.95) * | <0.001 |
Adjusted model was adjusted for age, sex, education, occupation, BMI, sleep duration, smoking status, alcohol intake, physical activity, and prevalent diseases.
b Appendicular lean mass was only measured during a three-year follow-up in the Xiangya Sarcopenia Study, we utilized the linear regression model to calculate the associations with daytime napping frequency.
*P<0.05.
REFERENCES: NIL.
Acknowledgments: NIL.
Disclosure of Interests: None declared.