fetching data ... 
Background: Systemic lupus erythematosus (SLE) is a complex autoimmune disease characterised by a wide range of clinical and serological manifestations. To date, research has partially clarified several cellular drivers of disease, including aberrant pro-inflammatory T cells, compromised regulatory T cells, dysregulation of B cells and elevated circulating B-cell activating factor (BAFF).
Clinical trials of targeted immunotherapies for SLE have been less successful than other autoimmune diseases, with the BAFF monoclonal antibody belimumab and the anti-type I interferon (IFN) receptor monoclonal antibody, anifrolumab, being the only current biologics approved for SLE treatment. Despite having these targeted treatments, patient response is modest, with half of the patients unable to attain the primary endpoint such as that seen in the BLISS-52 (Belimumab in Subjects with Systemic Lupus Erythematosus 52-week) trial for belimumab.
Objectives: Due to the heterogeneity of the SLE immunome, there is a critical unmet need to comprehensively assess and rank the relative contribution of the different immune cells that contribute to its immunopathogenesis to develop a cogent therapeutic strategy for precision rheumatology. To address this unmet need, we utilise high-dimensional mass cytometry coupled with our in-house analysis pipeline to interrogate the cryopreserved peripheral blood mononuclear cells (PBMC). We hypothesise that there are distinct effector and regulatory cell subsets in adult-onset SLE that are significantly different from healthy individuals. These unique cell populations could provide a framework for understanding SLE pathogenesis and offer a translational pathway toward novel diagnostic and therapeutic interventions.
Methods: Mass Cytometry was carried out on a cohort of adult-onset SLE patients and age-matched healthy controls. Subsequently, multi-parametric data collected were subjected to batch effect correction, clustering, and annotation of various immune cell subsets based on marker expression using our analysis pipeline. Cell frequencies were expressed as a percentage of total CD45 + cells. Data was presented as median (IQR) and P-value calculated using Mann-Whitney U test without assuming normality. For correlation analysis between cell frequency and disease severity, we calculated the Spearman’s correlation coefficient.
Results: Forty PBMC samples from 26 adult SLE patients were studied with a 43-marker mass cytometry antibody panel, along with samples from 23 age-matched adult healthy controls (females 19, 83%). The adult lupus patients (23 females, 88%) had a median age of 39.5 (interquartile range [IQR]: 28 to 53.5) years and a median SLEDAI 2K score of 4 (IQR: 0 to 6).
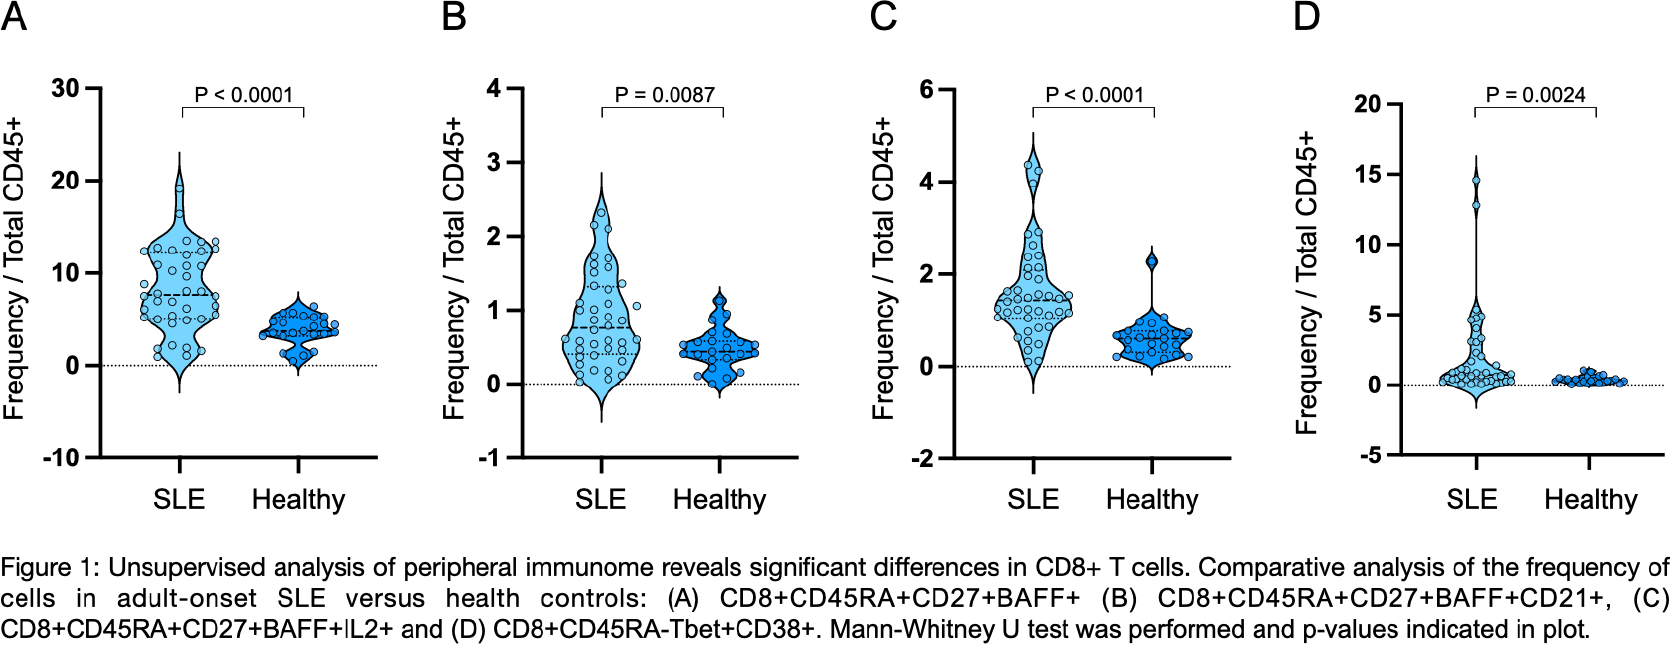
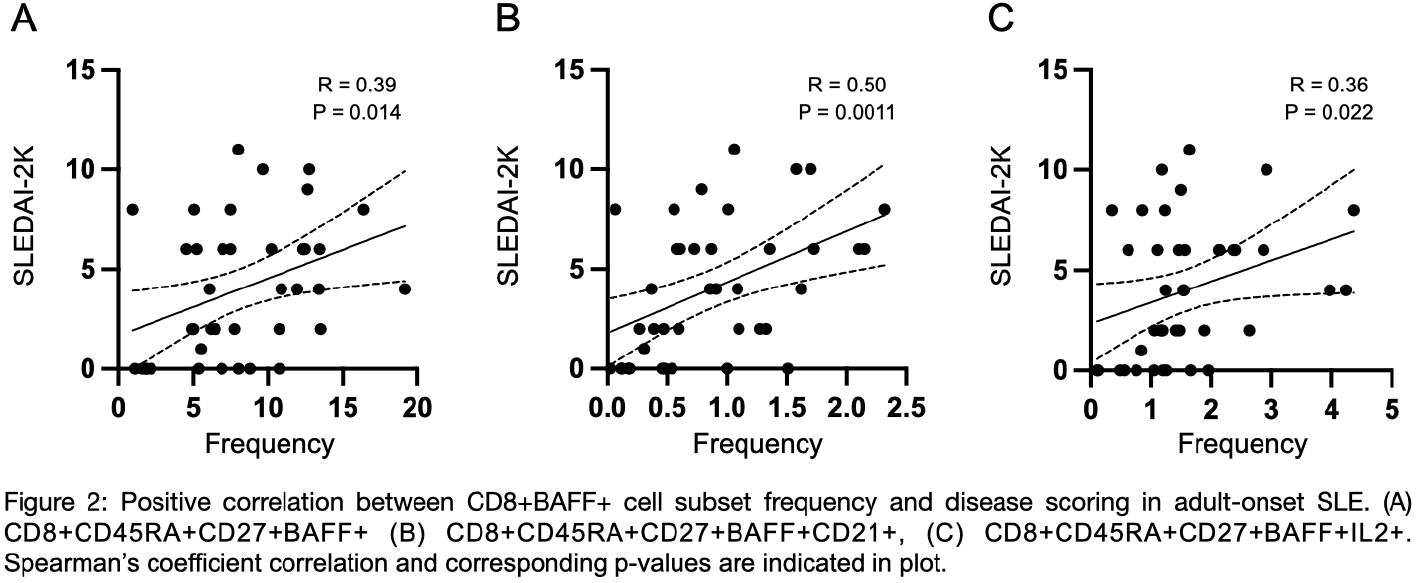
Our unsupervised clustering analysis revealed several significantly different CD8 + T cell subsets when comparing lupus to healthy controls. Shown in Figures 1 (A, B, C and D), corresponding to four cell clusters respectively (Cluster 1, Cluster 2, Cluster 3 and Cluster 4). Clusters 1 to 3 (CD8 + CD45RA + CD27 + BAFF + , CD8 + CD45RA + CD27 + BAFF + CD21 + and CD8 + CD45RA + CD27 + BAFF + IL2 + , respectively) were three distinct CD8+ T cell subsets, expressing BAFF, a cytokine important for B cell maturation. Cluster 1 (Figure 1A), was significantly increased in SLE compared to healthy controls: 7.7 (5.1 - 12)% versus 3.7 (3.2 - 5.2)% (p<0.0001). Cluster 2 (Figure 1B) was significantly increased in SLE compared to healthy controls: 0.76 (0.41 - 1.3)% versus 0.44 (0.33 - 0.58)% (p=0.0042). Cluster 3 (Figure 1C) was significantly increased in SLE compared to healthy controls: 1.4 (1.1 - 2.1)% versus 0.6 (0.31 - 0.77)% (p<0.0001). Cluster 4 (Figure 1D) had a distinctly different phenotype compared to the other 4 clusters (CD8 + CD45RA - Tbet + CD38 + ), likely representing CD8 + immune cell activation. This was significantly increased in SLE versus healthy controls: 0.74 (0.29 - 2.9)% versus 0.32 (0.19 - 0.50)% (p=0.0153). Importantly, we observed a significant correlation with disease activity scoring (SLEDAI-2K) in clusters 1, 2 and 3 but not 4 (Figures 2A, B and C), putatively indicating its importance in mediating disease activity.
Conclusions: While SLE has been traditionally known to be a B cell centric disease, our approach in utilising high-dimensional mass CyTOF to investigate the cellular differences between adult-onset SLE versus age-matched healthy controls revealed differences in the T-cell compartment. We describe distinct alterations in the four distinct CD8+ T cell clusters. Importantly, three of these distinct CD8+CD45RA+ clusters expressing BAFF (Cluster 1,2 and 3) were found to have a significant positive correlation between disease scoring and frequency. Such a finding highlights the potential role of these unique CD8 + BAFF + T cells in SLE pathogenesis and subsequently as a potential therapeutic target to inform future SLE treatment strategies.
Unsupervised analysis of peripheral immunome reveals significant differences in CD8+ T cells. Comparative analysis of the frequency of cells in adult-onset SLE versus health controls: (A) CD8+CD45RA+CD27+BAFF+ (B) CD8+CD45RA+CD27+BAFF+CD21+, (C) CD8+CD45RA+CD27+BAFF+IL2+ and (D) CD8+CD45RA-Tbet+CD38+. Mann-Whitney U test was performed and p-values indicated in plot.
Positive correlation between CD8+BAFF+ cell subset frequency and disease scoring in adult-onset SLE. (A) CD8+CD45RA+CD27+BAFF+ (B) CD8+CD45RA+CD27+BAFF+CD21+, (C) CD8+CD45RA+CD27+BAFF+IL2+. Spearman’s coefficient correlation and corresponding p-values are indicated in plot.
REFERENCES: [1]
[2]
[3]
[4]
Acknowledgments: NIL.
Disclosure of Interests: None declared.