fetching data ... 
Background: Systemic lupus erythematosus (SLE) is a chronic autoimmune disease characterised by systemic inflammation and progressive organ damage, and predominantly affects women. Lupus nephritis (LN) occurs in up to 50% of SLE patients and represents a major cause of morbidity and mortality. Current clinical biomarkers inadequately reflect early molecular alterations preceding irreversible renal injury. Lipidomics provides comprehensive insights into inflammatory and oxidative processes, potentially enabling improved disease stratification and early detection of renal involvement.
Objectives: The aim of the present study was to characterise serum lipidomic alterations in SLE patients with and without renal involvement and to identify lipid markers associated with SLE and LN.
Methods: The human serum samples (36 SLE patients without nephritis, 50 LN patients, and 30 age- and sex-matched controls) were analysed using reversed-phase liquid chromatography coupled with mass spectrometry. Statistical evaluation included univariate and multivariate analyses, and lipid network visualisation to assess class-specific changes and structural trends.
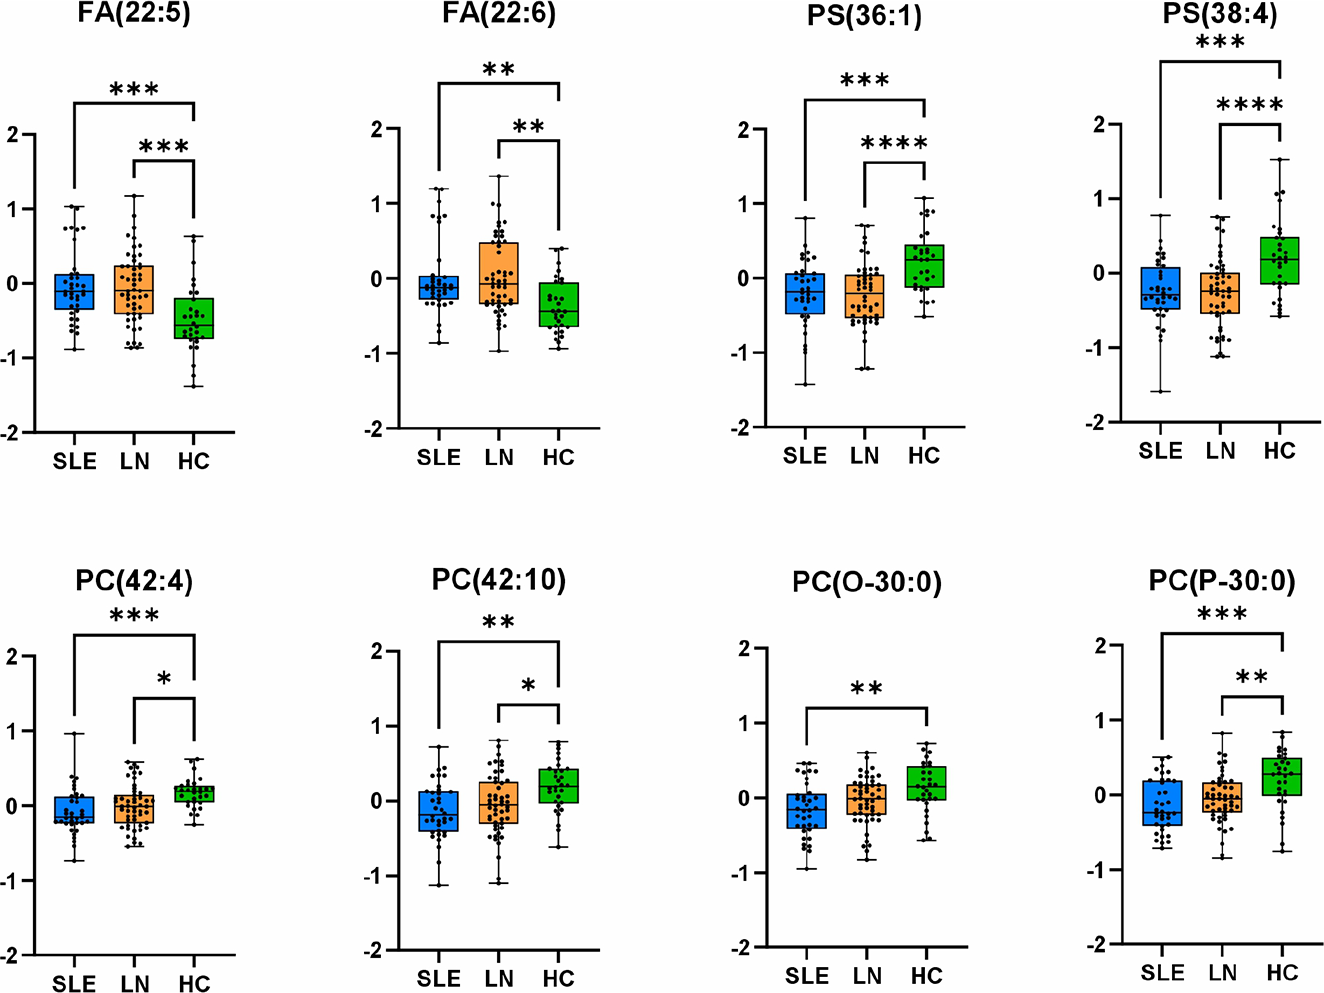
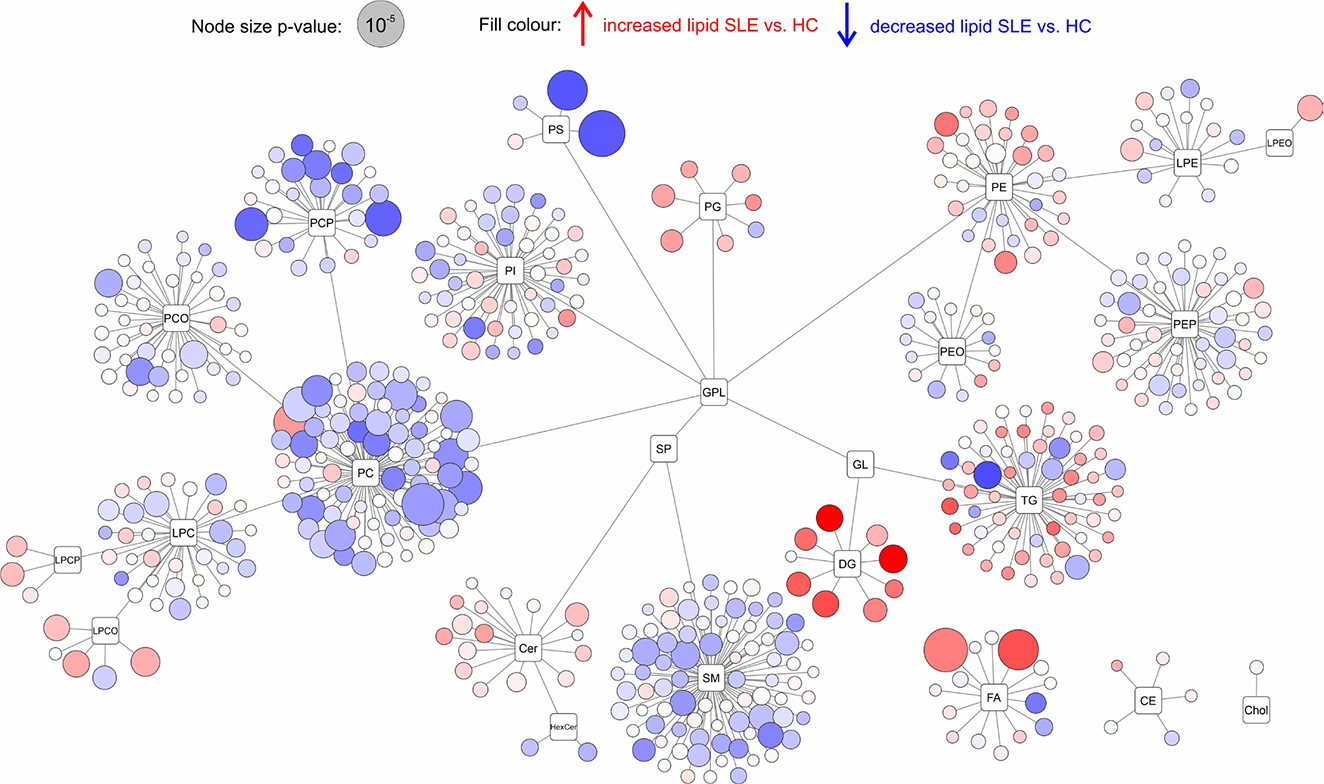
Results: The multivariate statistical method of principal component analysis revealed no significant separation between sample groups, indicating that disease-associated alterations involve specific lipid pathways rather than global shifts in the lipidome. The most pronounced lipidomic changes involved ether-linked glycerophospholipids. Alkyl- and vinyl-ether phospholipids (PC-O, PE-O, PC-P, PE-P) were consistently decreased in both SLE and LN patients compared to the control group, consistent with increased oxidative stress and impaired peroxisomal lipid metabolism. Conversely, selected lyso-ether phospholipids were increased, reflecting enhanced ether phospholipid cleavage and membrane remodelling. Particularly, the depletion of ether-linked phospholipids was more pronounced in SLE patients than in LN patients, despite renal involvement representing a more severe clinical phenotype. This pattern may reflect more intensive immunosuppressive treatment in LN patients, suggesting that lipidomic alterations could partially respond to therapeutic modulation. Polyunsaturated phosphatidylcholines (PC-PUFA) were significantly reduced, accompanied by elevated circulating free polyunsaturated fatty acids (PUFA), particularly FA_22:5 ( p = 6.6×10 −5 ) and FA_22:6 ( p = 2.2×10 −5 ), indicating enhanced phospholipase-mediated release from membrane phospholipids. In addition, phosphatidylserines PS_36:1 ( p = 9.9×10 −6 ) and PS_38:4 ( p = 7.5×10 −5 ) were markedly decreased, consistent with oxidative degradation of arachidonate-containing species and increased apoptotic membrane remodelling in immune cells. These lipid-level alterations were consistently observed across all study groups in boxplot analyses (Figure 1), demonstrating the robustness and reproducibility of the identified disease-specific lipid signatures. Lipid class connectivity mapping (Figure 2) visualised coordinated metabolic changes, with node size reflecting statistical significance and colour indicating abundance changes in SLE compared with controls. To further contextualise lipidomic alterations at the pathway level, BioPAN analysis was used as a complementary approach to infer relative activation or suppression of lipid metabolic routes based on coordinated class-level abundance changes and Z-score calculations. BioPAN pathway analysis revealed activation of PS-to-PE metabolic routes (Z= 4.575), supporting biologically coherent, pathway-level regulation rather than isolated lipid alterations.
Conclusions: Serum lipidomics reveals disease-specific lipid signatures in systemic lupus erythematosus and lupus nephritis reflecting oxidative stress, immune activation, and membrane restructuring. These associated lipid alterations highlight the potential of lipidomics for enhanced disease stratification and early detection of renal involvement in SLE, warranting validation as prognostic biomarkers.
Differential abundance of key lipid species across study groups. Boxplots display normalised abundances of eight discriminatory lipid species, including fatty acids [FA(22:5), FA(22:6)], phosphatidylserines [PS(36:1), PS(38:4)], and phospholipids [PC(42:4), PC(42:10), PC(O-30:0), PC(P-30:0)] in systemic lupus erythematosus (SLE, n = 36), lupus nephritis (LN, n = 50), and controls (HC, n = 30). Individual data points represent biological replicates; boxes indicate interquartile range (IQR) with median line; whiskers extend to 1.5× IQR. Statistical comparisons were performed using one-way ANOVA with post-hoc testing. Significance levels: * p < 0.05, ** p < 0.01, *** p < 0.001, **** p < 0.0001.
Map of lipids showing the entire divided into individual lipid classes and subclasses. The size of the circles represents the p-value (Welch’s t-test) between SLE patients and control samples.
REFERENCES: NIL.
Acknowledgments: NIL.
Disclosure of Interests: None declared.