fetching data ... 
Background: Persistent intrarenal inflammation in spite of immunosuppression contributes to kidney damage in lupus nephritis (LN). Treatment response is typically monitored using proteinuria, which often does not reflect changes in histologic activity over time. Repeat biopsy can capture residual activity but is not routinely done, motivating noninvasive approaches to track tissue-level inflammation. Urinary proteomics are an emerging alternative to quantify molecular pathways associated with baseline activity and longitudinal changes in activity, and to predict treatment response.
Objectives: We aimed to use per protocol repeat kidney biopsies and matching urine proteomics to define biological pathways associated with baseline histologic activity and with longitudinal changes in NIH Activity Index over 1 year. We also evaluated whether these pathway signatures differentiate histologic responders from non-responders and outperform proteinuria in reflecting tissue-level activity.
Methods: Twenty LN patients enrolled in Belgium and Sweden underwent a diagnostic and a per-protocol kidney biopsy one year after diagnosis. Treatment was discretionary. Urine samples were collected at the time of diagnosis and after one year, at the time of a per-protocol repeat biopsy, and profiled using Olink Explore HT (5416 proteins). Pathway analyses was performed using the Reactome database with gene set variation analysis (GSVA) and gene set enrichment analysis (GSEA), and statistical associations were tested using linear regression models. Histologic response was defined in patients with proliferative LN as a ≥50% reduction in NIH Activity Index from baseline to 1 year resulting in NIH AI ≤ 3 at 1 year.
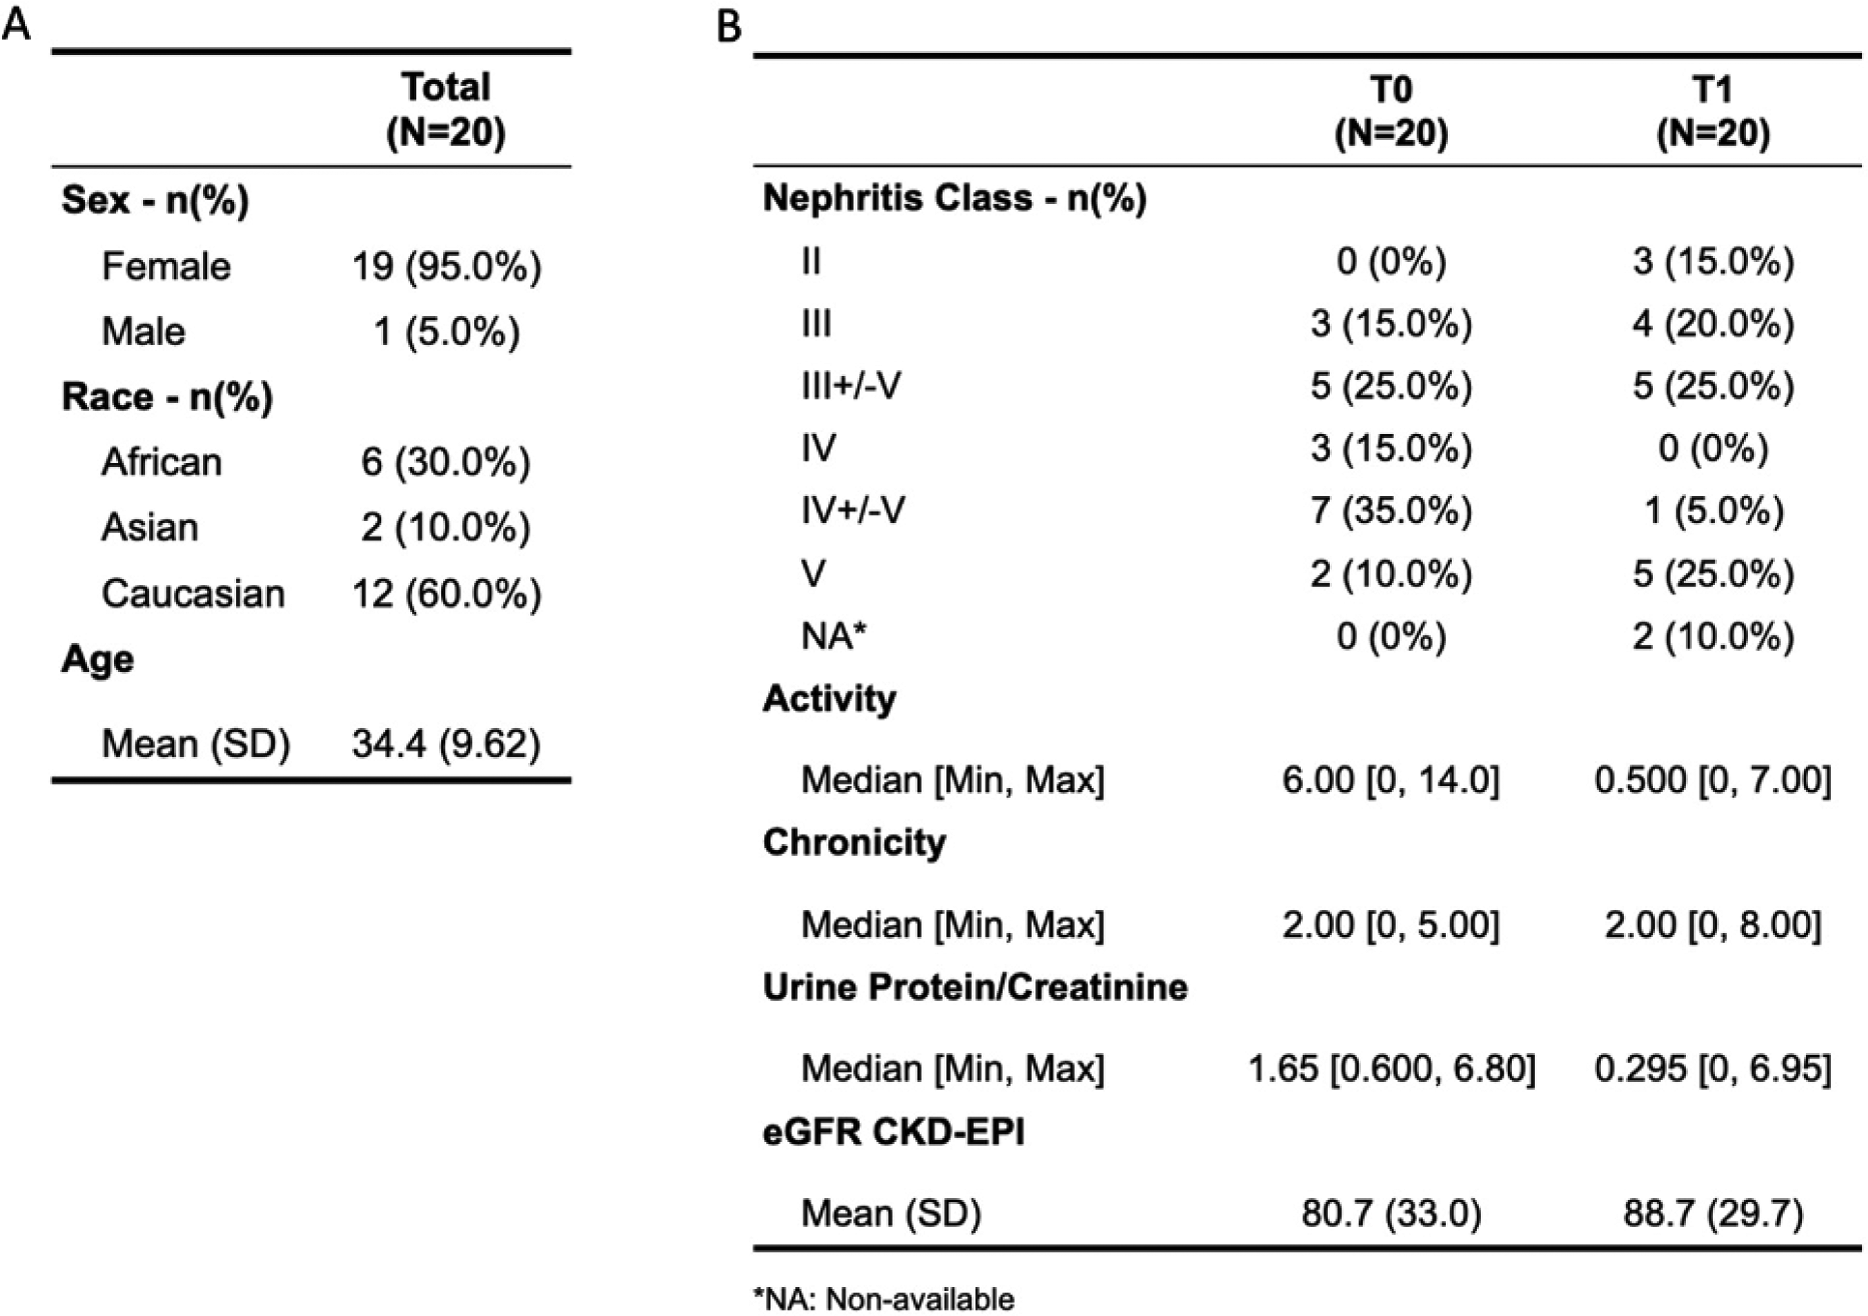
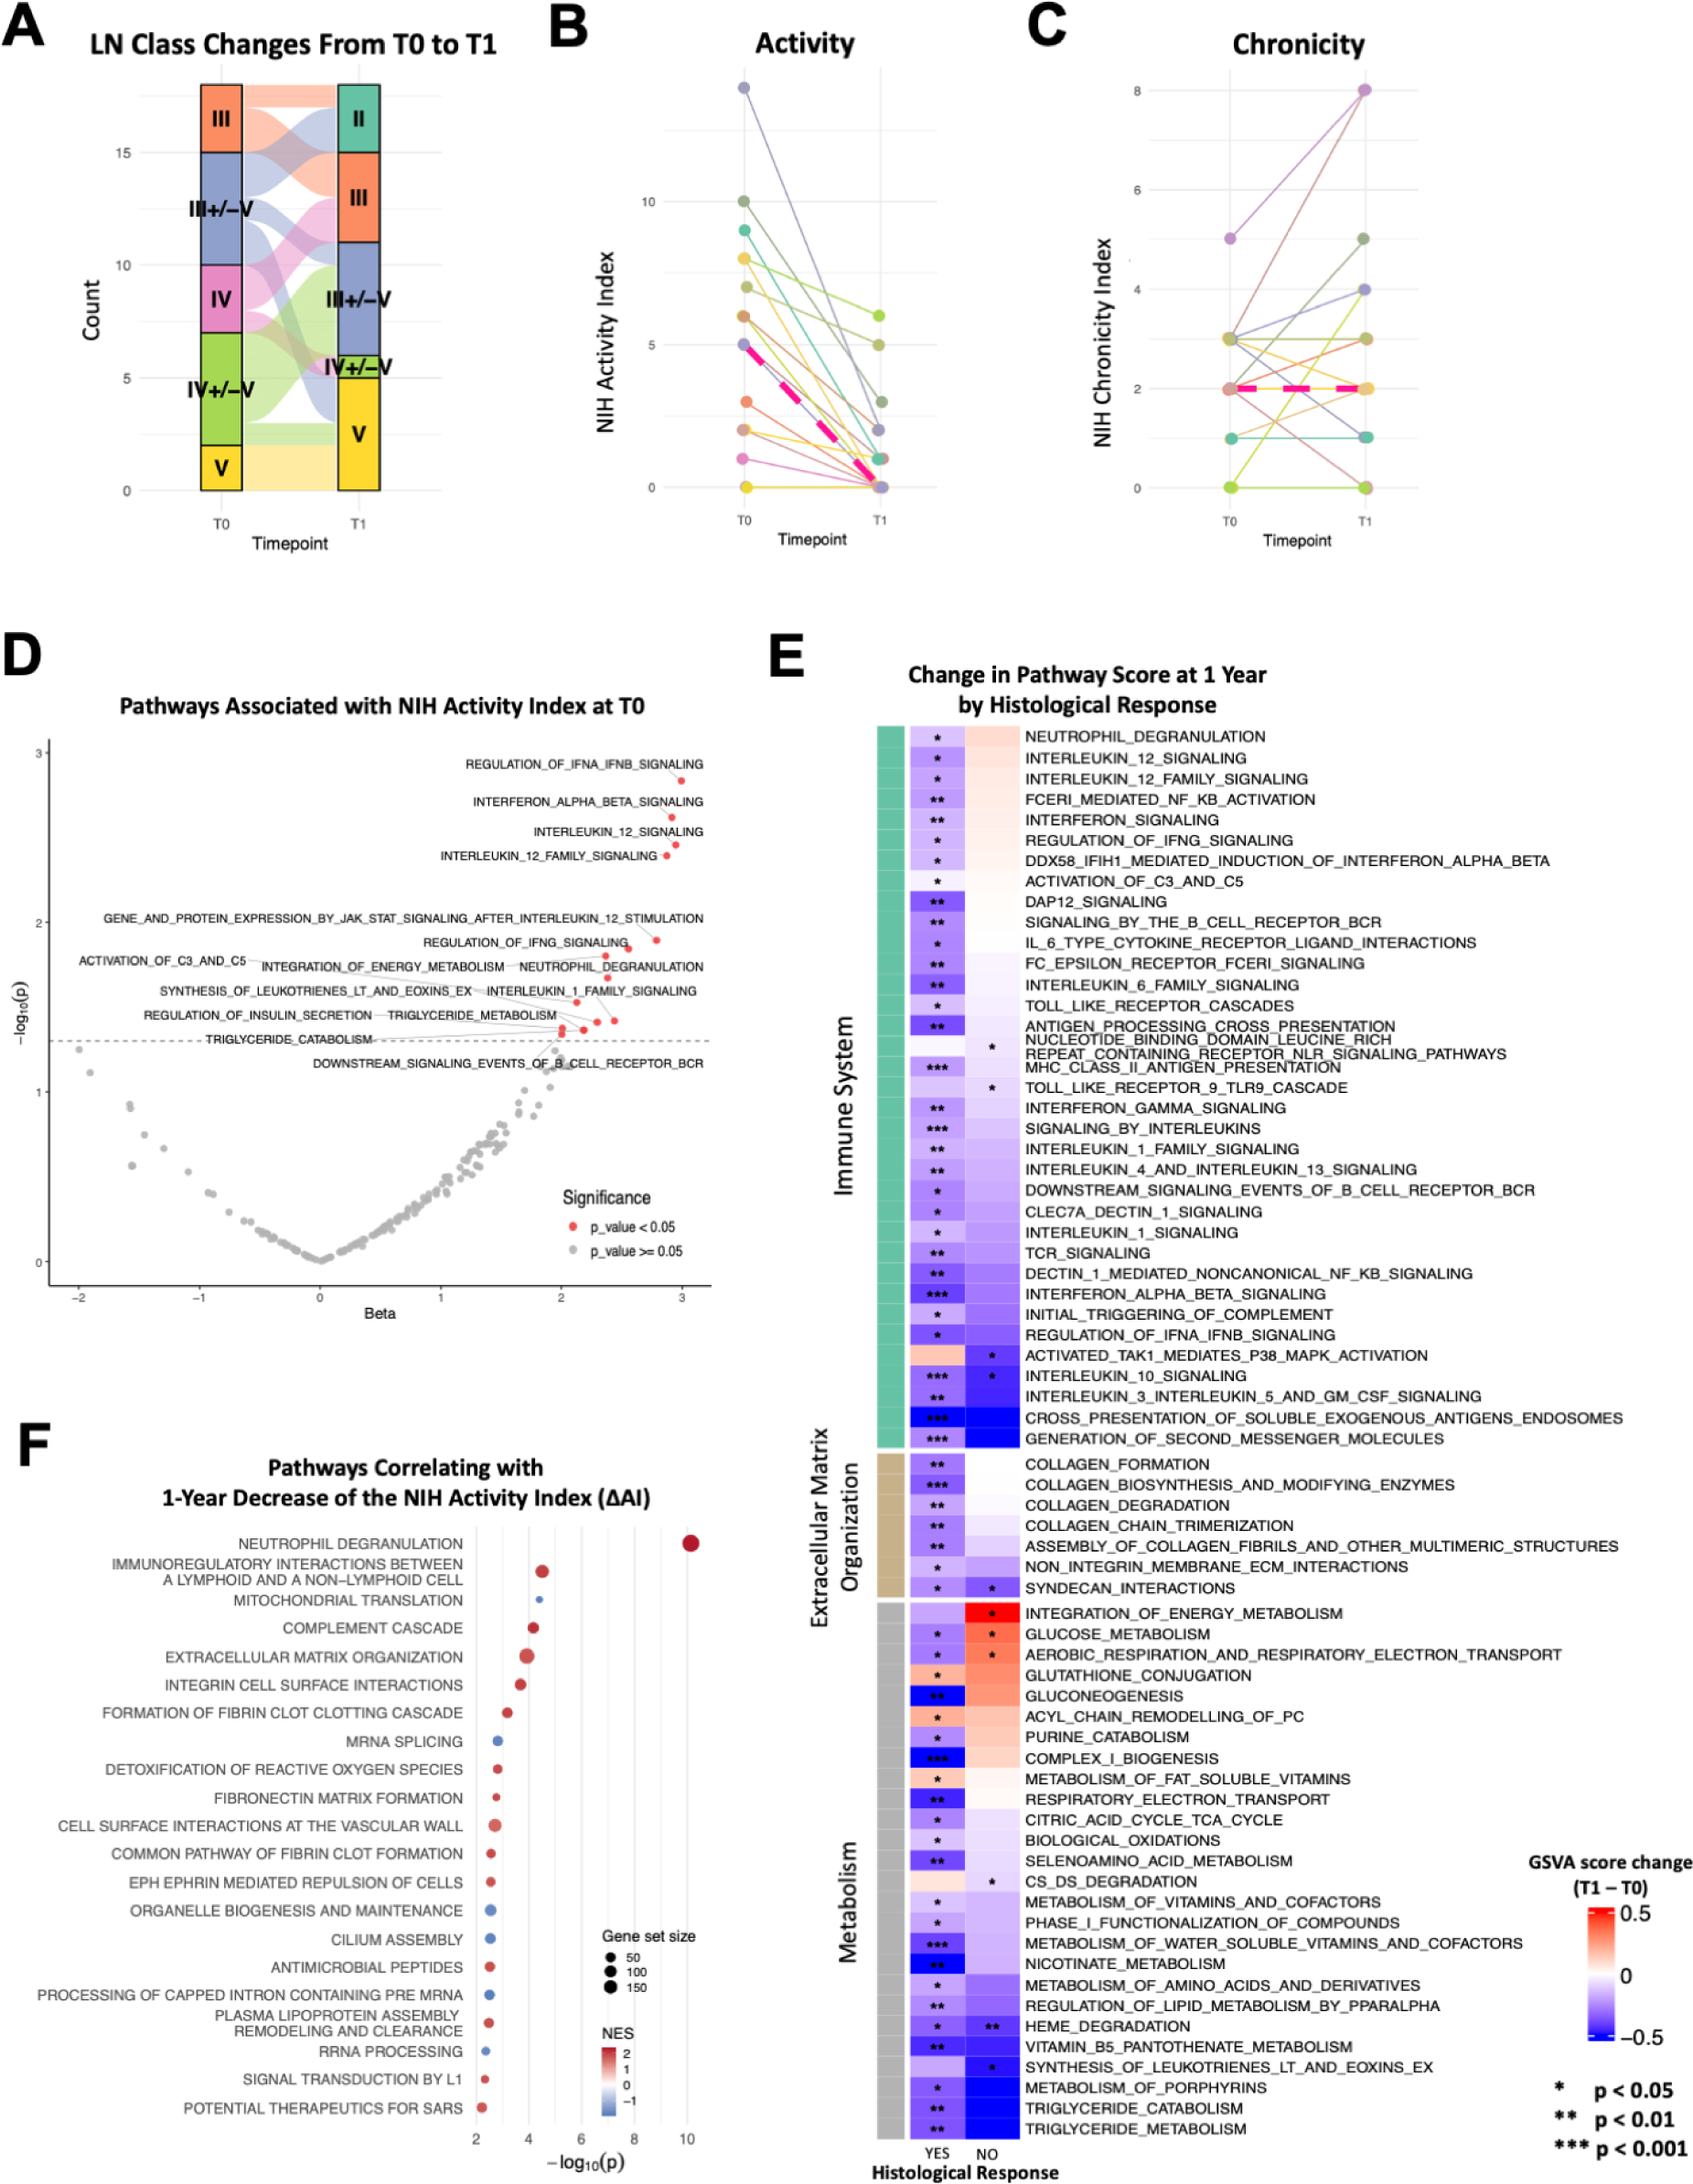
Results: At baseline, 18/20 (90%) had ISN/RPS class III or IV +/- V LN and 2/20 (10%) pure class V ( Table 1 ). Paired biopsies at one year were available for 18 patients (16 proliferative). After one year of treatment, 6/16 (37%) patients transitioned from proliferative to non-proliferative classes; nonetheless, the NIH Activity Index (AI) declined in all proliferative LN, with 12/15 (80%) achieving histological response. ( Figure 1A - 1C ). Proteomic pathway analysis showed that baseline histologic activity was associated with pathways related to immune-activation (i.e., type 1 interferon, IL-12 signaling, complement activation, and neutrophil degranulation), increased metabolism, and extracellular matrix (ECM) remodeling ( Figure 1D ). After one year, responders demonstrated broad downshifts in immune and ECM remodeling pathways with accompanying metabolic changes, whereas non-responders showed incomplete pathway normalization ( Figure 1E ). Similarly, reduction in NIH AI correlated with reduction of neutrophil/complement pathways together with coagulation/hemostasis and ECM remodeling ( Figure 1F ), but not with proteinuria.
Conclusions: In these preliminary results, interferon and IL-12 signaling, complement activation, and neutrophil degranulation correlated with baseline histologic activity and showed coordinated downshifts in responders but incomplete normalization in non-responders, suggesting that successful LN treatment needs to induce broad suppression of multiple tissue inflammatory programs. Responders also demonstrated greater normalization of ECM-remodeling pathways, consistent with reduced ongoing injury and a shift toward tissue repair, whereas non-responders retained elevated glucose metabolism and aerobic respiration signatures, indicating persistent energy demand and ongoing inflammatory tissue stress. Immune, coagulation, and ECM-remodeling pathways tracked changes in activity over time, supporting urine proteomics as a noninvasive approach to monitor tissue-level activity beyond what routine clinical measures or even what repeat renal biopsy may capture.
Table 1. Patient demographics and histological features at baseline and one-year repeat biopsy. (A) Demographic and (B) clinical characteristics including ISN/RPS class, NIH Activity and Chronicity indices, urine protein-to-creatinine ratio (UPCR), and estimated glomerular filtration rate (eGFR) at baseline (T0) and one-year follow-up (T1). *Paired biopsies at 1 year were available for 18 patients: one biopsy was unsuccessful, and one patient declined repeat biopsy.
Longitudinal histology and pathway signatures of lupus nephritis (LN) over 1 year.
(A) Alluvial plot shows individual transitions in ISN/RPS class from T0 to T1, highlighting class change from proliferative to non-proliferative LN. (B) Individual paired trajectories of NIH activity index, showing reduction at T1 for all patients with AI >0 at baseline. (C) Chronicity index at T0 and T1. The medians of the NIH Activity and Chronicity Indices at T0 and T1 are shown by the pink dashed line. Only patients with paired biopsies included (n=18) (D) Volcano plot of Reactome pathway GSVA scores associated with AI at T0 (adjusted for NIH Chronicity Index); x-axis shows regression β (direction of association) and y-axis shows −log10(p). Significant pathways (p<0.05) are highlighted in red, and annotated pathways are drawn from the Immune System, Metabolism, and Extracellular matrix organization roots. (E) Heatmap of change in pathway GSVA scores (T1–T0) over one year stratified by histologic response (Yes vs No). Colors represent direction/magnitude of change (red higher at T1; blue lower at T1); asterisks denote significance levels. (F) GSEA of proteins whose longitudinal changes correlate with changes in AI (ΔAI). Dots represent enriched Reactome pathways plotted by −log10(p-value) (FDR < 0.2); color indicates the direction and effect size of the association (normalized enrichment score, NES) and dot size reflects gene-set size.
REFERENCES: NIL.
Acknowledgments: NIL.
Disclosure of Interests: Andrea Fava Biogen, UCB, Sanofi, AnnexonBio, BMS, TG Therapeutics, AstraZeneca, UCB, Exagen, Bain Capital, Artiva, Quotient Therapeutics, Zenas, Biogen, Abbvie, Novartis, Argenx, MPM Capital, Autolus Ltd, GSK, Chen-Yu Lee: None declared, Rufei Lu: None declared, Carla Guthridge: None declared, Ryan Chou: None declared, Dionysis Nikolopoulos: None declared, Julius Lindblom: None declared, Farah Tamirou: None declared, Judith A. James: None declared, Michelle Petri: None declared, Joel M Guthridge: None declared, Frederic Houssiau: None declared, Ioannis Parodis: None declared.