fetching data ... 
Background: Juvenile idiopathic arthritis (JIA) is the most prevalent chronic inflammatory arthritis in childhood. The synovial tissue is the primary site of inflammation, yet its complex cellular architecture and the spatial organization of pathogenic cell interactions remain poorly understood. A comprehensive, high-resolution map of the JIA synovial microenvironment is needed to identify key drivers of disease and potential therapeutic targets.
Objectives: To use subcellular-resolution spatial transcriptomics to create a detailed cellular and molecular atlas of the JIA synovium. We aimed to: 1) identify the diverse immune and stromal cell populations present in active disease; 2) characterize their organization into distinct spatial niches; and 3) uncover the key signaling pathways mediating their crosstalk.
Methods: We performed high-plex spatial transcriptomic profiling on synovial biopsy samples from nine patients with active oligoarticular/polyarticular JIA ( Figure 1a ). A custom computational pipeline was developed and applied to identify cell types, define spatial niches, and perform neighborhood enrichment and single-cell colocalization analyses.
Results: Our analysis revealed diverse immune and stromal cell populations ( Figure 1b ) organized into four major spatial niche classes: T+B/plasma cell, Myeloid+Stromal, Myeloid+T cell, and Stromal niches ( Figure 1c ), each with distinct functional pathway enrichment, including angiogenesis-related pathways in stromal niches ( Figure 1d-g ) and IFN-α/γ signaling in Myeloid-T cell–enriched niches ( Figure 1h-k ). We identified significant microanatomical structures, including a NOTCH3-mediated signaling axis between sublining fibroblasts and endothelial cells ( Figure 2a-e ). We also uncovered critical immune crosstalk, such as a CXCL9-CXCR3 chemokine axis driving the colocalization of pro-inflammatory macrophages and CD8 + T cells ( Figure 2f-h ). Organized tertiary lymphoid structures (TLS) were detected, characterized by interactions between Tph/Tfh cells and mregDCs via CXCL13-CXCR5 and CCL19-CCR7 signaling ( Figure 2i-j ).
Conclusions: This high-resolution spatial atlas provides a detailed molecular framework of JIA synovitis, revealing spatially organized pathogenic niches driven by specific immune-stromal crosstalk. Key interactions, such as the endothelial-fibroblast NOTCH3 axis and the macrophage-T cell CXCL9-CXCR3 axis, help to advance our understanding of JIA pathogenesis and represent potential therapeutic targets.
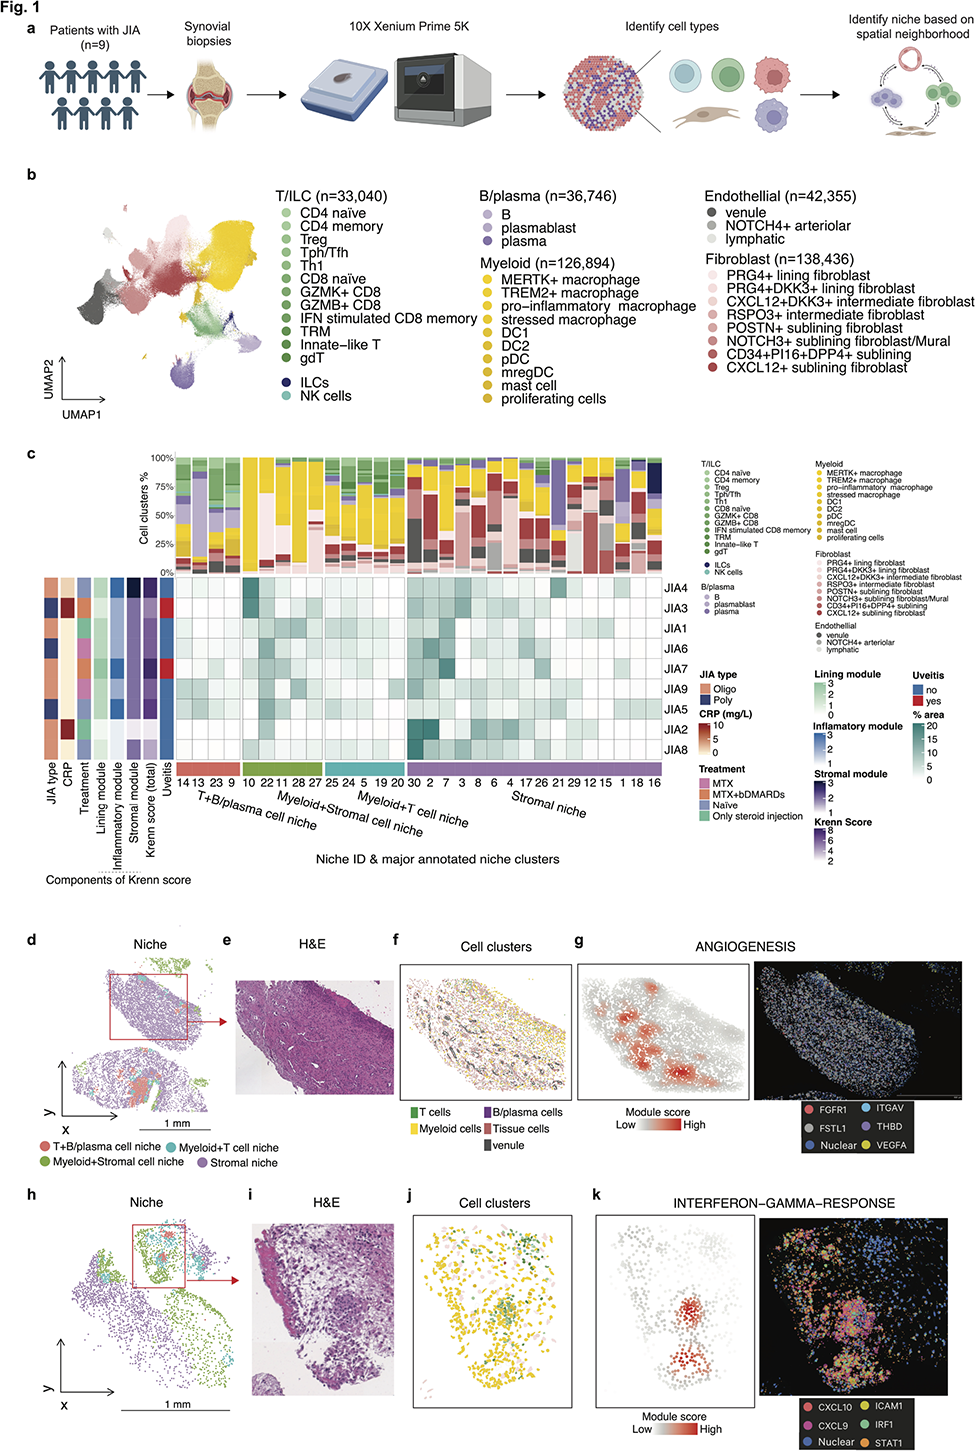
Spatial transcriptomic profiling of synovial tissue in JIA patients and characterization of spatial niches. a, Synovial biopsy samples were collected from nine patients diagnosed with JIA. Subcellular resolution spatial transcriptomic data was acquired from FFPE biopsy samples using the 10X Xenium Prime 5K platform. Cell types within synovial tissues were identified, and spatial neighborhoods were characterized based on spatial proximity analysis. b, Identified major immune and tissue-associated cellular compartments in synovium. c, The central heatmap displays the percentage area of 30 spatial niches (columns) for each patient (rows). Patient samples are annotated by clinical features on the left. The bar plots above illustrate the proportional composition of cell clusters for each corresponding niche. Spatial niches are grouped by the major annotated niche clusters shown at the bottom. d–e, Representative images of association between niche clusters and ANGIOGENESIS pathway. Spatial mapping of annotated niches ( d ) from a representative synovial tissue section and H&E staining ( e ). f , Spatial distribution of cell clusters in the zoom-in of the section in panel d . g , Left, spatial enrichment score of the ANGIOGENESIS pathway. Right, Corresponding DAPI and expression of representative genes of the pathway. h–i, Representative images of association between niche clusters and INTERFERON−GAMMA−RESPONSE pathway.
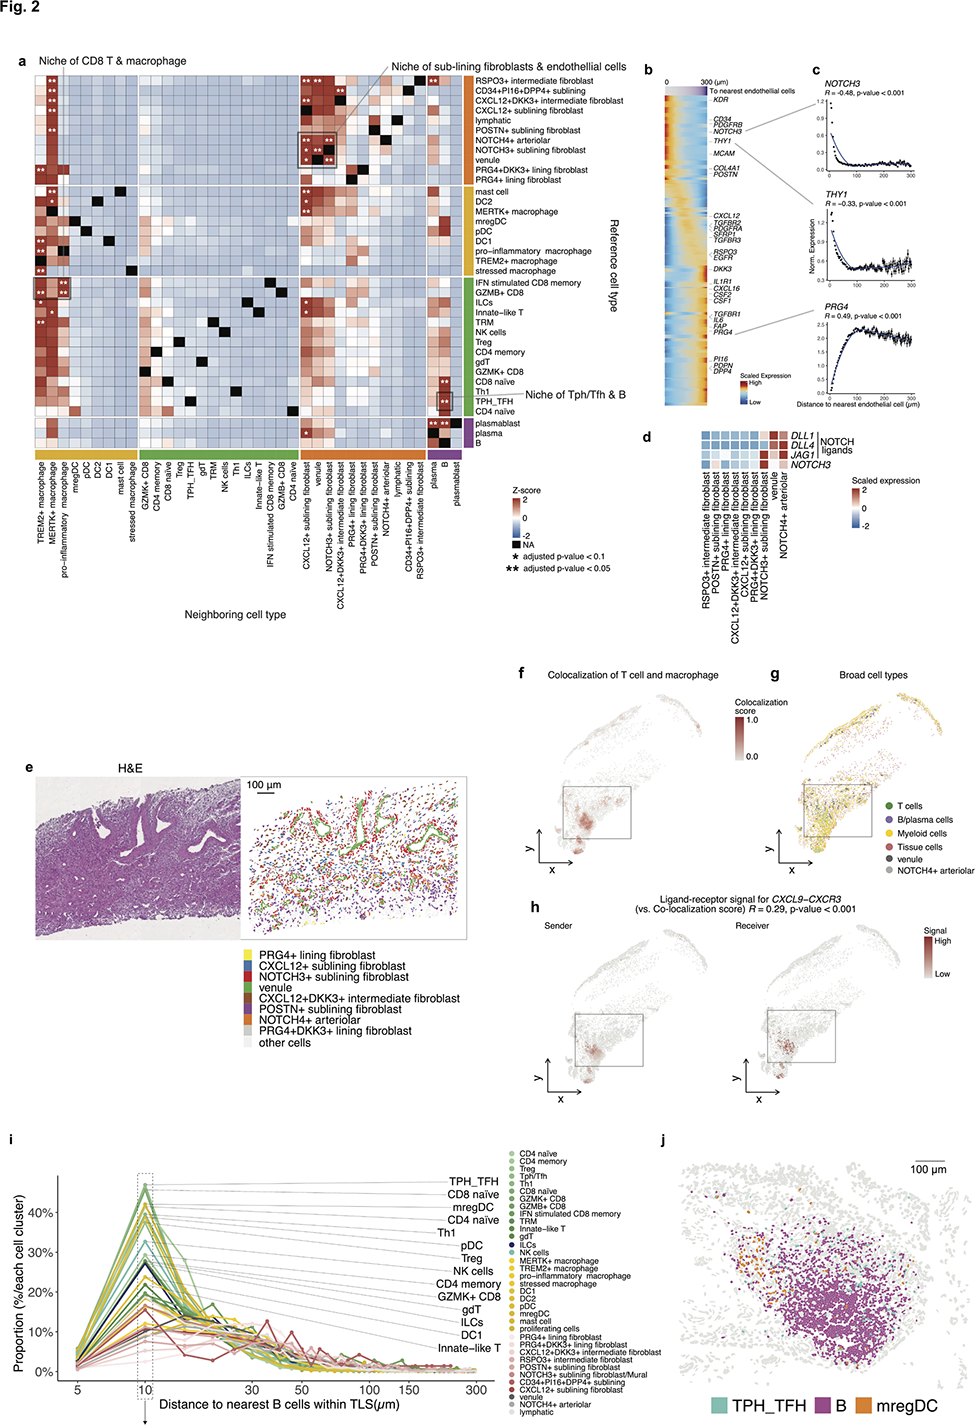
Spatial neighborhood enrichment in JIA synovium. a, Spatial neighborhood enrichment using our data from samples of JIA synovium. Statistical significance is indicated as * (adjusted p-value < 0.1) and ** (adjusted p-value < 0.05). The highlighted grey square indicates the niche of sublining fibroblasts and endothelial cells. P -values were adjusted by the Benjamini-Hochberg method. b , The heatmap displays the relationship between distances to nearest endothelial cells (purple bar above) and fibroblast gene expression. Rows represent fibroblast-associated genes, and columns represent individual fibroblasts. Fibroblast marker genes are labeled. c . Line plots depicting binned distance to nearest endothelial cells (x-axis) and normalized gene expression (y-axis) of representative fibroblast genes. Statistical significance was assessed using Spearman correlation coefficients and p-values. d , Heatmap of gene expressions related to Notch signaling pathway components across different cell types. e , Representative spatial coordinates of an identified niche of sublining fibroblasts and endothelial cells, matching pathological images. Cells are colored according to their cluster assignments. f , Spatial heatmap of colocalization scores between T cells and macrophages. g , Spatial map of broad cell type annotation including T cells, myeloid cells, B/plasma cells, and tissue cells. h , Spatial ligand–receptor analysis results for CXCL9–CXCR3, which exhibited the strongest correlation with macrophage–T cell co-localization scores. i , Line plot showing the proportion of each immune cell cluster (y-axis, % of total cells within each cluster) relative to its binned distance to the nearest B cell within identified TLS regions (x-axis, log-scaled). Each line represents a distinct immune cluster, with colors corresponding to the cluster identities. Points denote the proportion per 5-μm distance bin, and annotations on the right indicate the top clusters based on peak proximity to B cells. j , Representative TLS region showing colocalization of Tph/Tfh cells, B cells, and mregDCs.
REFERENCES: NIL.
Acknowledgments: NIL.
Disclosure of Interests: None declared.