fetching data ... 
Background: Rheumatoid Arthritis (RA) is a chronic progressive autoimmune disease where early diagnosis and appropriate treatment is crucial for preventing joint damage. While ultrasound imaging is an established method in the detection of joint inflammation, it can be labour-intensive and requires trained operators. Thermography offers a quick, non-invasive imaging approach that captures surface temperature changes associated with underlying joint inflammation. However, interpretation of thermal images remains subjective. This study explores the use of artificial intelligence (AI) to automate the analysis of thermal hand images for the detection of RA joint inflammation.
Objectives: This study aims to evaluate the performance of an AI-driven thermal imaging model for classifying RA joint inflammation, using wrist-level Power Doppler (PD) scores as ground truth, with the goal of establishing a potential first-level screening tool.
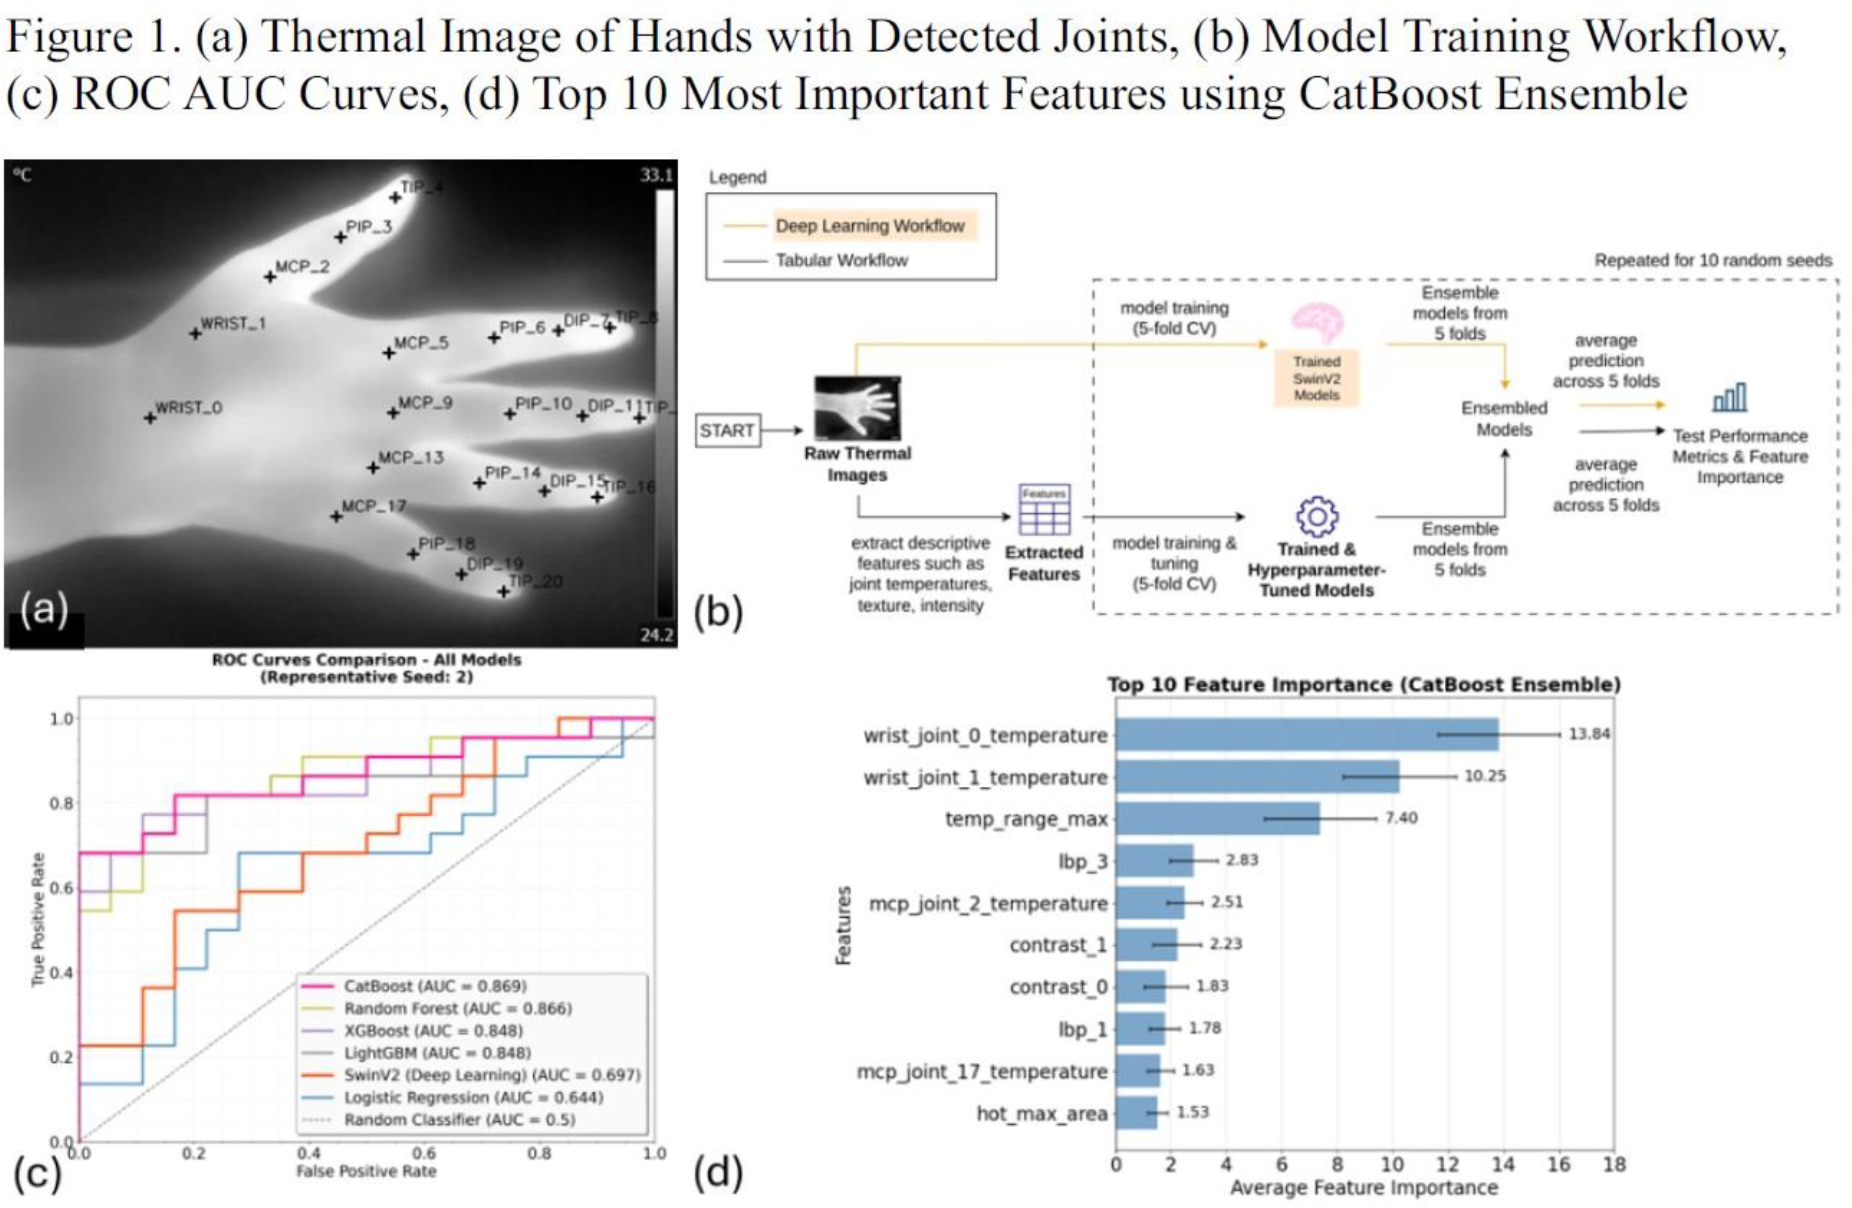
Methods: A total of 200 dorsal hand thermal images from 100 RA patients were acquired with the use of high resolution thermography performed under controlled room temperature. Ultrasound PD joint inflammation was scored semi-quantitatively (0-3) at the dorsal wrist joint (radio-carpal and inter-carpal joint recesses) following previous validated scoring system [1]. Each hand thermal image was clinician-labelled as RA-wrist PD joint inflammation positive or negative based on the ultrasound PD findings. The Swin Transformer v2 model, a pre-trained deep learning image classification model (microsoft/swinv2-large-patch4-window12-192-22k) was fine-tuned on the dataset. In parallel, a tabular machine learning (ML) approach (Figure 1b) was implemented using descriptive, interpretable features extracted from the thermal images that quantitatively capture visible patterns, shapes, and temperature intensities. Each image produced 69 features capturing anatomical and texture information: (1) joint temperature features from 21 anatomical landmarks, (2) Gray-Level Co-occurrence Matrix-based texture features (contrast, correlation, homogeneity, energy, entropy) computed at multiple orientations, (3) Local Binary Pattern (LBP) histograms describing fine textures, (4) statistical pixel intensity features (mean, standard deviation, skewness, kurtosis, percentiles), and (5) hotspot geometry descriptors reflecting shape and area of high-temperature regions. The dataset was split into 80% training and 20% testing using stratified sampling. Within the training set, five-fold cross-validation with Optuna-based hyperparameter tuning was applied to all models (Logistic Regression, Random Forest, CatBoost, LightGBM, and XGBoost), optimizing for area under the receiver operating characteristic (ROC) curve (AUC). The Swin Transformer v2 model was fine-tuned using the same cross-validation and evaluation setup but without hyperparameter tuning. For each fold, the best-performing model was saved, and final test predictions were obtained by soft voting across folds. This entire process was repeated with 10 different random seeds to ensure robustness.
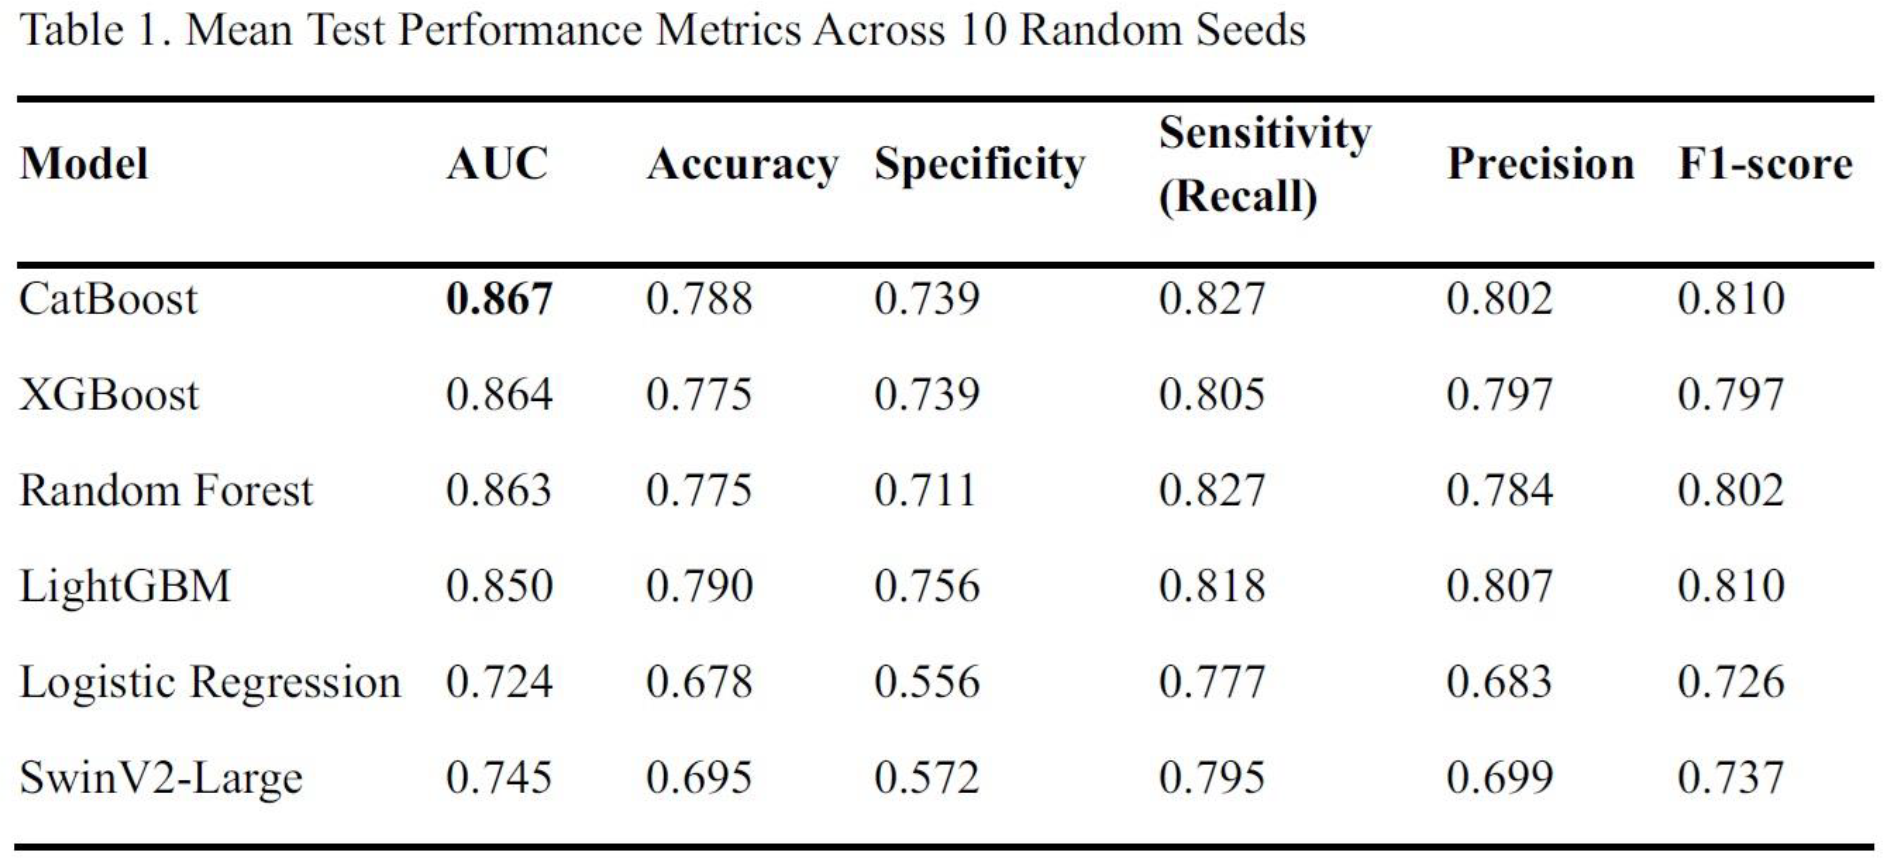
Results: Across all tested algorithms, CatBoost consistently achieved the highest results (AUC 0.867) on the test set as shown in Table 1 and Figure 1c. While XGBoost, Random Forest, and LightGBM achieved comparable AUC values, CatBoost offered the best balance of accuracy (0.788), sensitivity (0.827), specificity (0.739), precision (0.802) and F1-score (0.810) correctly identifying the most RA-wrist PD joint inflammation positive cases while maintaining low false-positive rates. In contrast, the deep learning SwinV2-Large model performed significantly worse, further emphasizing the advantage of the feature-based approach for smaller datasets. Feature importance analysis from the CatBoost ensemble (Figure 1d) highlighted that absolute wrist joint temperatures were the most influential predictors, aligning with clinical expectations that inflammation elevates local temperature in these regions. Additionally, LBP 3 (small edge of bright spots) suggests the prevalence of hottest spots in RA patients. Other important features included temperature range and texture properties that describe the patterns, shapes, and intensities of heat around inflamed joints. This means the model was able to recognize both concentrated hot spots directly over joints and broader heat patterns in nearby areas, showing local inflammation and how surrounding tissues responded.
Conclusions: This study demonstrates the feasibility of AI-enhanced thermal imaging for RA joint inflammation detection. The dominance of joint temperature and texture-related features suggests that physiological heat distribution patterns and micro-texture variations may serve as early, quantifiable indicators of inflammation. The achieved performance (AUC 0.87) compares favourably with the thermography-based method by Morales-Ivorra I. et al [2]. (AUC 0.78), and while slightly lower than deep learning models using multimodal ultrasound imaging by He et al [3]. (AUC up to 0.95), it underscores the potential of thermal imaging as a rapid and non-contact alternative for RA joint inflammation screening. Future work will extend this framework to larger cohorts, integrate explainability tools for clinical interpretability, and assess its feasibility for routine use.
REFERENCES: [1] Terslev L, et al. RMD Open. 2017;3:e000427.
[2] Morales-Ivorra I, et al. RMD Open. 2022;8:e002458.
[3] He X, et al. Rheumatology (Oxford). 2024;63:866-873.
Acknowledgments: NIL.
Disclosure of Interests: None declared.