fetching data ... 
Background: Osteoarthritis (OA) is a leading cause of disability worldwide, and its prevalence continues to increase with aging populations and rising obesity rates. Obesity (OB) is a major risk factor for OA, acting through both mechanical and metabolic mechanisms, and OB-related OA is considered a distinct OA phenotype. However, its molecular basis remains poorly defined, underscoring the need for improved molecular characterization to better understand the disease heterogeneity of OA and support clinical stratification and targeted treatment development.
Objectives: This study aimed to identify and validate proteomic markers for OB-related OA by integrating proteomic and genetic data, to help decipher underlying mechanisms and pathogenesis of this OA subtype.
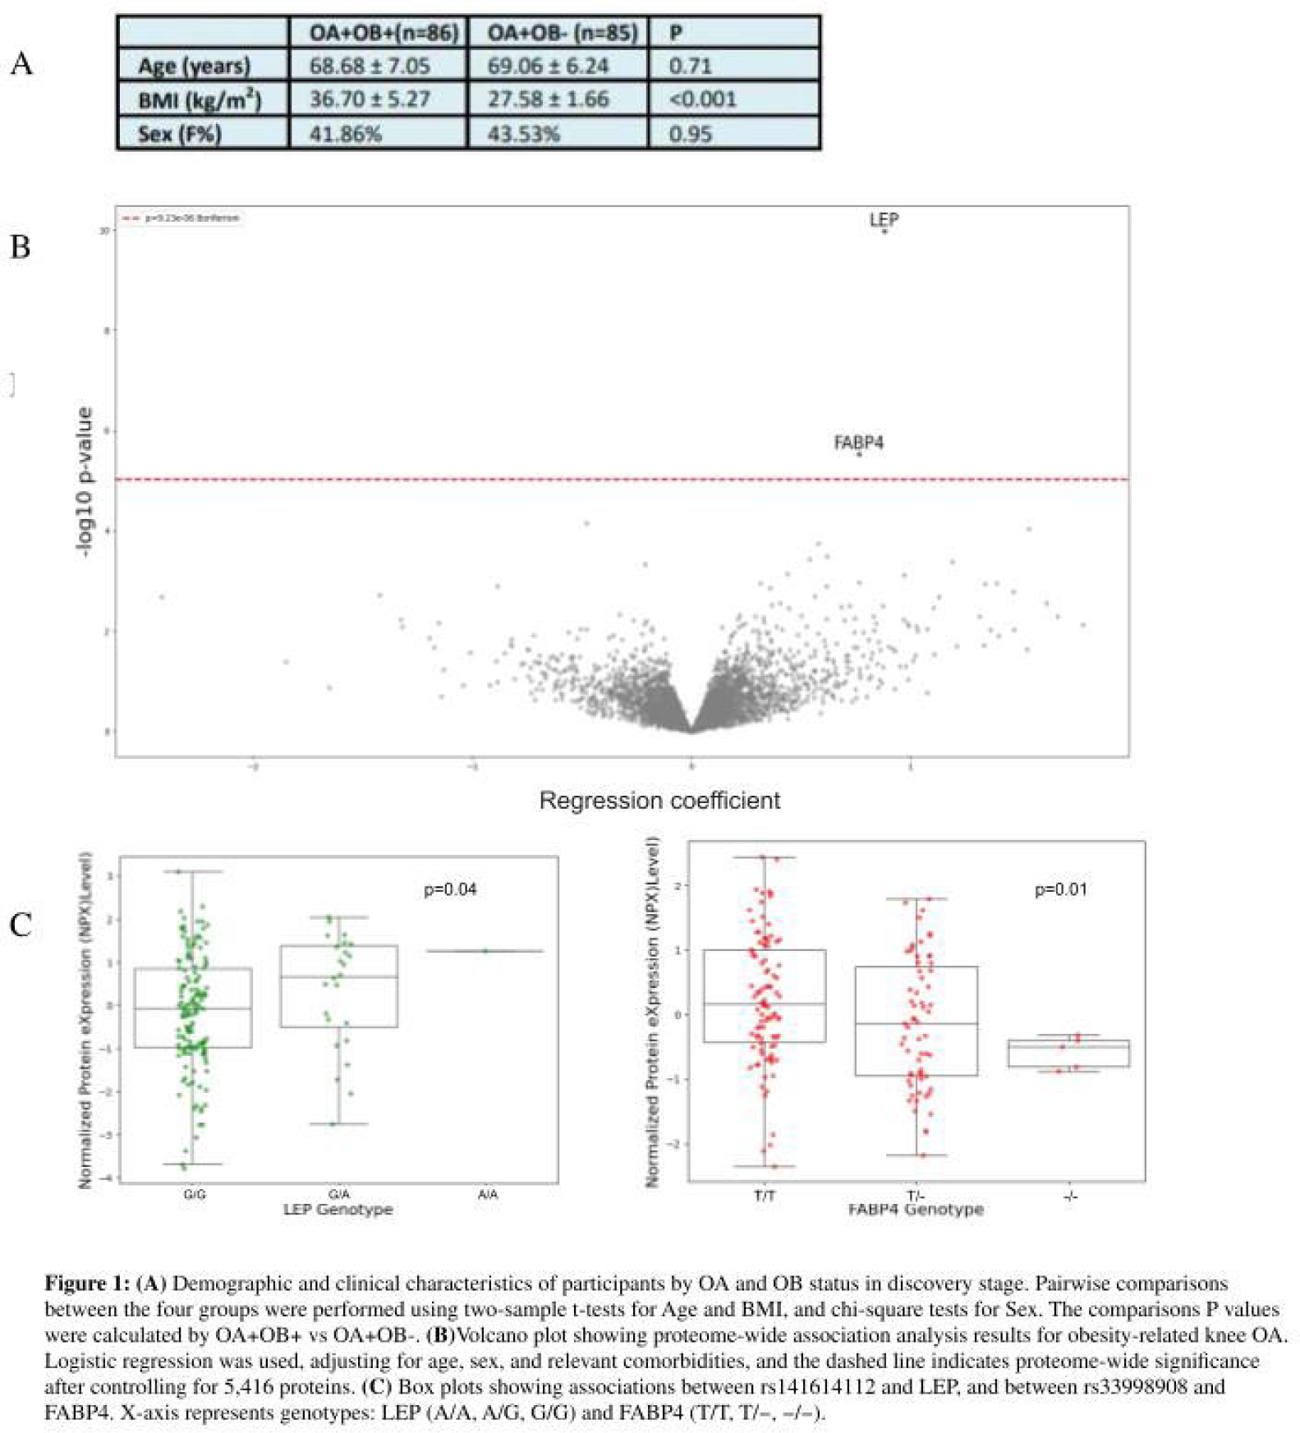
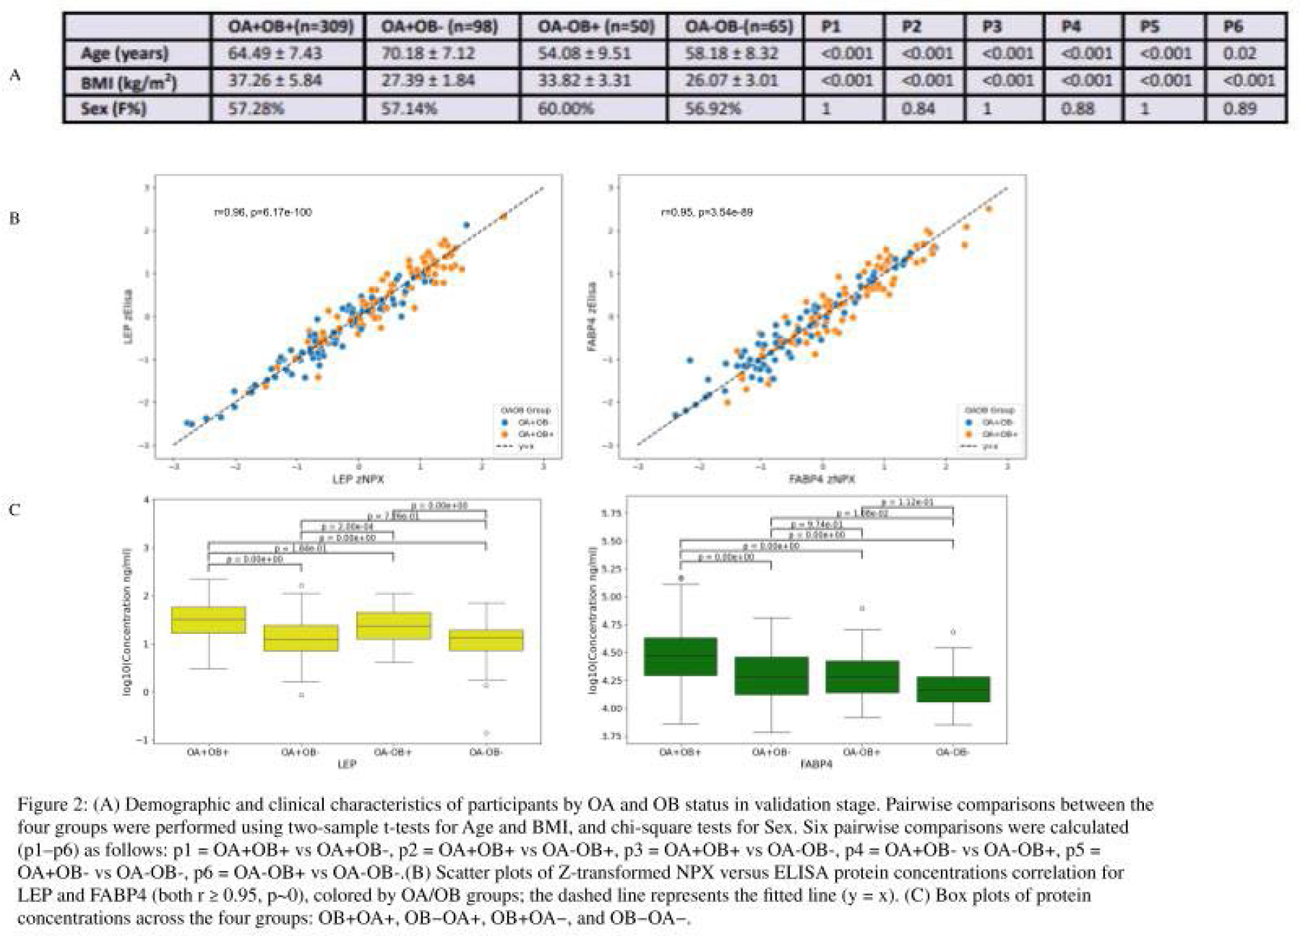
Methods: Study participants of the current study were derived from two independent cohorts originated from the same source population: the Newfoundland Osteoarthritis Study (NFOAS), which is composed of patients who underwent knee or hip arthroplasty due to primary OA and other joint diseases, and Complex Diseases in the Newfoundland population: Environment and Genetics (CODING), which is composed of healthy Newfoundland residents. This study utilized a two-stage study design and focused on primary knee OA (KOA). In the discovery stage, obese (OB+OA+, BMI≥30) and non-obese KOA patients (OB-OA+, BMI<30) with matching age, sex, and comorbidities were selected from the NFOAS, and high-throughput proteomic profiling was performed on preoperative fasting plasma samples using the Olink Explore HT platform. Logistic regression models with adjustment for age, sex, hypertension, hyperlipidemia, other cardiovascular diseases, and diabetes were used to identify proteins significantly associated with the OB+OA+ phenotype, and multiple testing was corrected using the Bonferroni method. Blood DNA was genotyped using either Illumina Omni-2.5 or Global Diversity Array genotyping platforms (Illumina, San Diego, CA, USA), and the associations between genetic variants within the genes encoding the identified proteins and the expression levels of corresponding proteins were examined using linear regression, while the associations between these variants and OB+OA+ were assessed using logistic regression. In the validation stage, proteins identified in the discovery phase were quantified by enzyme-linked immunosorbent assays (ELISA) in fasting plasma samples from the CODING and NFOAS. ELISA protein concentrations and Olink Normalized Protein eXpression (NPX) values were normalized using Z-score, and Pearson correlation analysis was then performed to evaluate the concordance between OLINK and ELISA measurements. ELISA concentrations of the four groups (OB+OA+, OB-OA+, OB+OA-, and OB-OA-) were compared using post hoc Tukey’s honestly significant difference (HSD) tests with adjustment for age and sex.
Results: In the discovery stage, 86 OB+OA+ and 85 OB-OA+ patients were included (Figure 1A). A total of 5,416 proteins were measured and passed quality control. Proteomic analysis revealed that leptin (LEP; p=1.05×10 − 10, odds ratio (OR)=2.41) and fatty acid-binding protein 4 (FABP4; p=2.91×10 −6 , OR=2.15) were significantly associated with OB+OA+ (Figure 1B). Genetic analysis identified SNPs rs141614112 (G>A) in LEP (p=0.04) and rs33998908 (delT) in FABP4 (p=0.01) as variants associated with their respective protein concentrations (Figure 1C). However, neither variant demonstrated a significant association with OB+OA+ (p≥0.97). In the validation stage, 115 CODING and 411 NFOAS participants were included (Figure 2A). ELISA measurements were obtained from 520 samples for LEP (308 OB+OA+, 99 OB-OA+, 50 OB+OA-, and 63 OB-OA-), and 522 samples for FABP4 (309 OB+OA+, 98 OB-OA+, 50 OB+OA-, 65 OB-OA-). ELISA measurements showed high concordance with Olink results for both proteins (r = 0.95, p<1.00×10 − 89; Figure 2B). Post-hoc Tukey HSD analyses based on age and sex adjusted linear mixed-effects models revealed distinct patterns for LEP and FABP4 across the four groups. LEP levels differed significantly between obese and non-obese groups irrespective of OA status, with significant differences observed for OA + OB + vs OA + OB − , OA + OB + vs OA − OB − , OA + OB − vs OA − OB + , and OA − OB + vs OA − OB − (all P a d j < 1.00×10 −7 ), whereas comparisons within the same OB category were not significant (OA + OB + vs OA − OB + , P a d j = 0.08; OA + OB − vs OA − OB − , P a d j = 0.80), indicating that LEP levels were primarily driven by OB rather than OA. In contrast, FABP4 levels showed strong associations with OA status and were further amplified by OB. FABP4 was significantly higher in OA + OB + compared with OA + OB − ( P a d j = 1.20×10 −8 ), OA − OB + ( P a d j = 2.45×10 −6 ), and OA − OB − ( P a d j = 3.76×10 −13 ). Additional significant differences were observed between OA + OB − and OA − OB − ( P a d j = 0.01), whereas comparisons not involving OA status were not significant (OA − OB + vs OA − OB − , P a d j = 0.11). The comparison between groups with both OA and OB differences (OA + OB − vs OA − OB + , P a d j = 0.97) showed no significant difference. Overall, FABP4 expression was associated with OA and potentiated by OB, with the highest levels observed in the OA + OB + group (Figure 2C).
Conclusions: Our data indicated that FABP4 protein might be a key biomarker for OB-related OA, and its association with OA + OB+ is likely influenced by metabolic and environmental factors rather than genetic variants. Further analyses are underway to assess causal relationships between OB, OA, and FABP4, to further evaluate its role in the development of OB-related knee OA, and to assist in risk stratification and the development of targeted therapy.
REFERENCES: NIL.
Acknowledgments: NIL.
Disclosure of Interests: None declared.