fetching data ... 
Background: Calcium pyrophosphate (CPP) deposition (CPPD) disease is a very common arthropathy. Imaging is an essential diagnostic tool, especially in the absence of microscopic evidence of CPP crystals in the synovial fluid. Conventional radiography is a first-line imaging modality in CPPD as it has high specificity and enables the quantification of osteoarthritis (OA). In this context, artificial intelligence (AI) approaches are emerging as promising tools for improving accuracy, reproducibility and standardisation of imaging techniques.
Objectives: 1) To develop and validate a deep learning algorithm to identify and quantify chondrocalcinosis and osteoarthritic changes on anteroposterior knee radiographs. 2) To create a preliminary semi-quantitative radiographic scoring system for assessing the extent of chondrocalcinosis at the knee level.
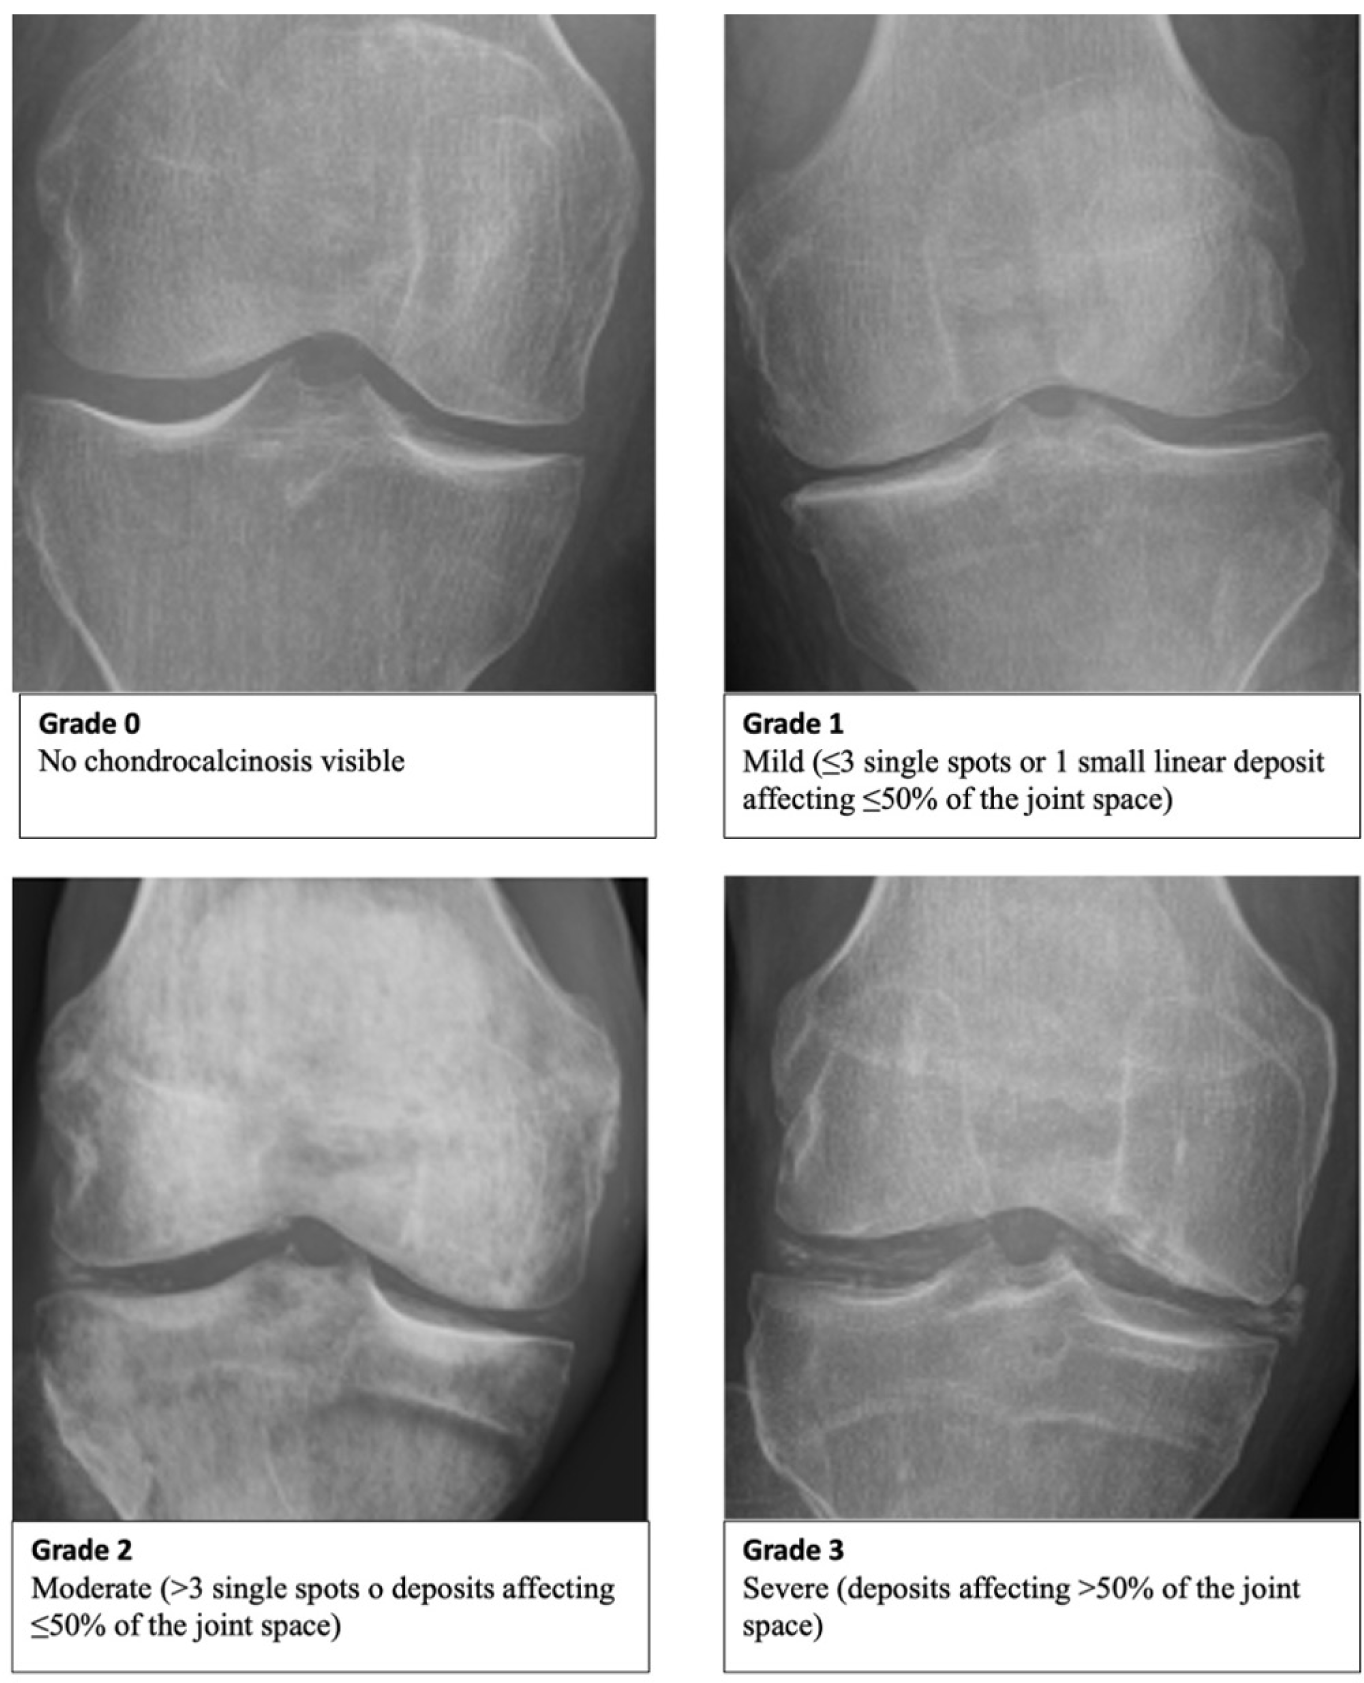
Methods: We collected consecutive anteroposterior knee radiographs from patients undergoing imaging at two Italian Institutions (Marche University Hospitals, Ancona and “Carlo Urbani” Hospital, Jesi). Four independent annotators assessed the images: one rheumatologist, two radiologists, and one radiology resident. Chondrocalcinosis was graded in both weight-bearing and non-weight-bearing radiographs using a preliminary 0–3 scale adapted from the recently OMERACT-validated ultrasound scoring system (Figure 1).
OA was assessed only on weight-bearing radiographs using the Kellgren–Lawrence (KL) scoring system. The inter- and intra-reader reliability was tested on a set of 40 images (10 for each grade of the scoring system) before the start of the study using an unweighted Cohen’s kappa. We split the dataset into training (70%), validation (15%) and testing (15%) sets to enable model development and validation by stratified sampling. We employed a ResNet-18 architecture pre-trained on ImageNet-1k as the backbone for all experiments. To investigate the impact of ordinal constraints, we compared two distinct approaches:
A baseline approach: ResNet-18 with a standard Softmax output layer, optimised using Categorical Cross-Entropy (CCE) as a nominal loss function.
An ordinal approach: ResNet-18 equipped with a Cumulative Link Model (CLM) layer, trained using ordinal-aware loss functions, specifically Triangular Cross-Entropy and Quadratic Weighted Kappa Loss.
We evaluated model performance using sensitivity, specificity, positive predictive value (PPV), negative predictive value (NPV), accuracy, F1-score (harmonic mean of precision/positive predictive value and recall/sensitivity) and Quadratic Weighted Kappa (QWK). The analyses were performed in Python.
Results: The radiographic score for chondrocalcinosis has a substantial inter- and intra-reader agreement of 0.62 (95%CI: 0.49-0.77) and 0.69 (95%CI: 0.56-0.83), respectively.
The final dataset consisted of 2,163 standard knee radiographs, of which 963 (44.5%) were weight-bearing. It included 815 (37.7%) grade 0, 371 (17.2%) grade 1, 477 (22.1%) grade 2, 500 (23.1%) grade 3 in terms of CPPD and 145 (15.1%) grade 0, 307 (31.8%) grade 1, 204 (21.2%) grade 2, and 195 (20.3%) grade 3, and 112 (11.6%) grade 4 in terms of KL.
Across all experiments, the CLM approach outperformed the nominal one in every metric for both OA and CC, as summarised in Table 1. Notably, the ordinal method achieved substantial agreement with the human assessment (QWK: 0.63 for CPPD and 0.80 for KL).
Conclusions: This AI algorithm demonstrates good performance in identifying and quantifying chondrocalcinosis and OA severity on knee radiographs. These findings highlight the potential role of AI as a supportive tool in radiological diagnosis, reducing inter-observer variability and enabling more rapid, standardised and efficient assessment. Future developments may include multicentre prospective validation and integration of the model into clinical workflows.
Semiquantitative scoring system for the quantification of chondrocalcinosis on knee radiographs
Performance comparison between the baseline (ResNet18+Softmax) and the ordinal model (ResNet18+CLM) on the CPPD and KL datasets.
| CPPD | KL | |||
|---|---|---|---|---|
| Softmax | CLM | Softmax | CLM | |
| Sensitivity | 0.44 | 0.47 | 0.37 | 0.41 |
| Specificity | 0.83 | 0.84 | 0.85 | 0.85 |
| PPV | 0.48 | 0.52 | 0.40 | 0.46 |
| NPV | 0.83 | 0.85 | 0.85 | 0.86 |
| Accuracy | 0.54 | 0.58 | 0.49 | 0.53 |
| F1-Score | 0.51 | 0.58 | 0.48 | 0.53 |
| QWK | 0.47 | 0.63 | 0.61 | 0.80 |
| CE | TCE | CE | QWK | |
The evaluation metrics are sensitivity, specificity, positive predictive value (PPV), negative predictive value (NPV), accuracy, F1-Score, and Quadratic Weighted Kappa (QWK). The bottom row indicates the loss function adopted for each experiment; for the CLM model, the configuration with the highest-performing loss function is displayed.
REFERENCES: NIL.
Acknowledgments: NIL.
Disclosure of Interests: None declared.