fetching data ... 
Background: Osteoarthritis (OA) is the most common joint disease, typically affecting weight-bearing joints such as knees and hips [1]. Affecting approximately 500 million individuals worldwide, the prevalence of OA is anticipated to rise mainly due to population aging [2]. The pathogenesis of OA involves a complex interplay of multiple risk factors, resulting in a lack of effective therapeutic approaches [3]. Thus, identifying and quantifying modifiable risk factors and enhancing OA surveillance represent crucial directions in current OA research.
Objectives: To evaluate the relationship between biological ages, and the prevalence and incidence of OA.
Methods: 332,261 participants from UK Biobank were analyzed. Biological aging was measured using phenotypic age (PhenoAge) [4] and Klemera-Doubal (KDMAge) [5]. KDMAge was derived from nine clinical biomarkers to gauge system integrity decline, while PhenoAge was computed from chronological age and nine clinical biomarkers to gauge mortality risk. Biological aging accelerations were computed as residuals from regressing KDMAge and PhenoAge against chronological age. The associations between biological aging and prevalence and incidence of OA were analyzed using logistic and Cox regression models.
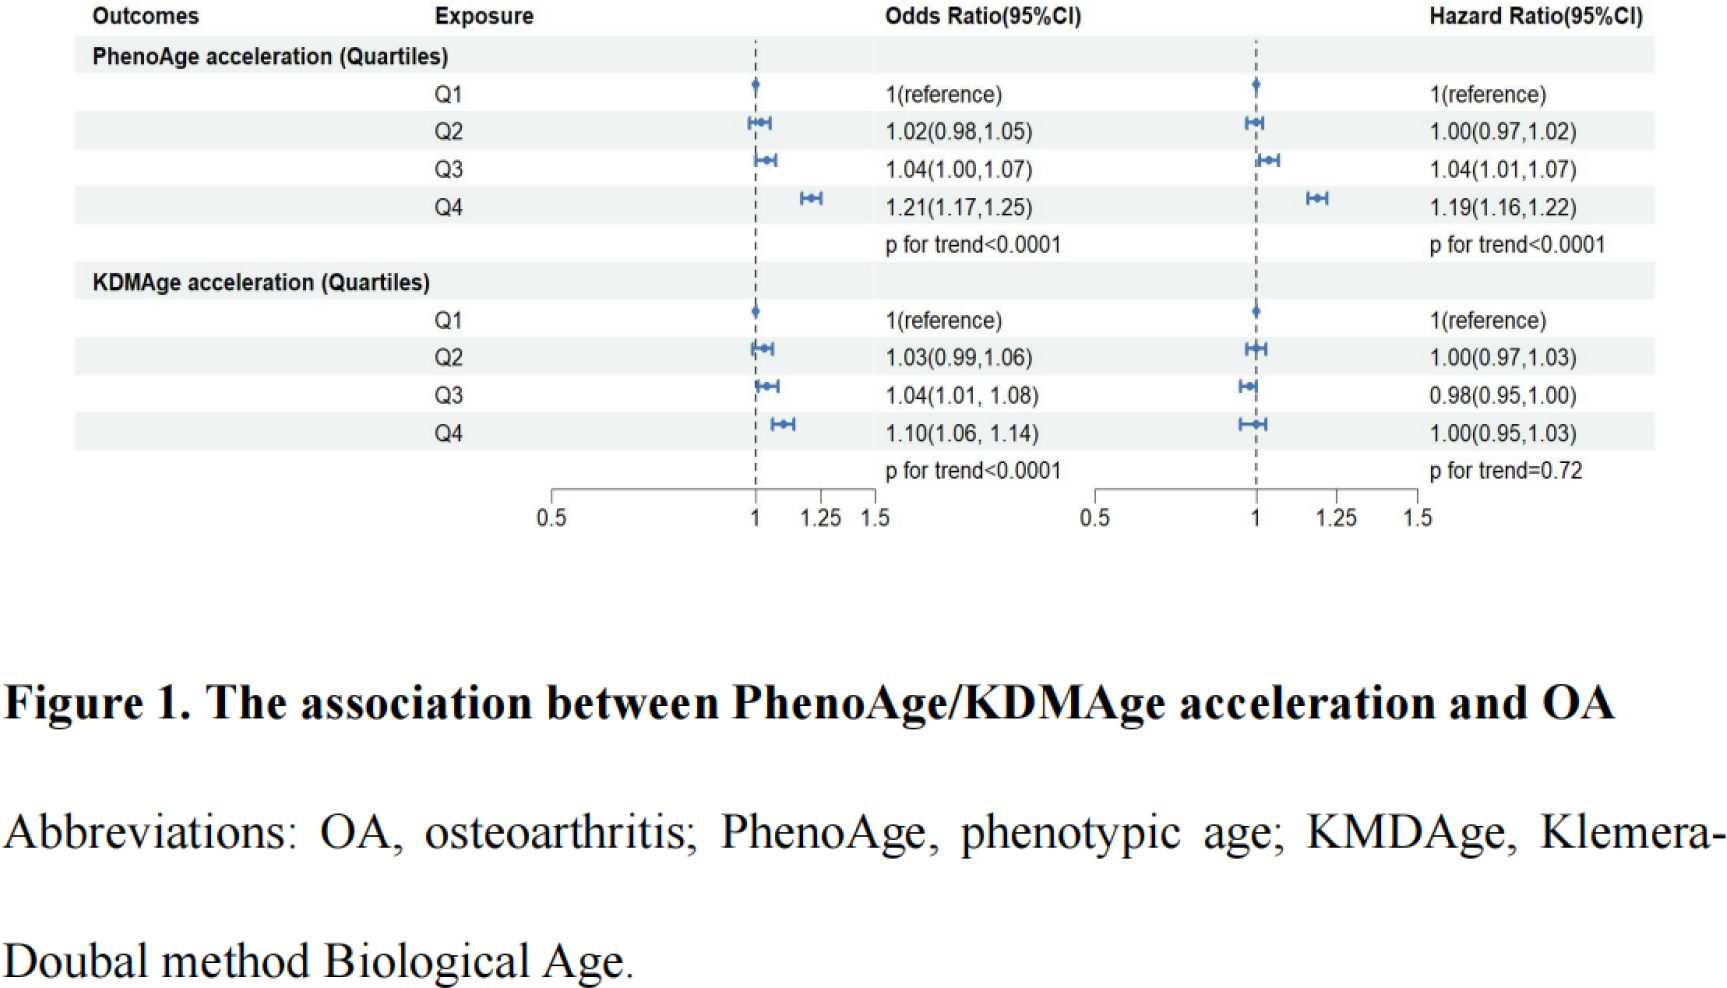
Results: At baseline, 55.4% of included individuals had younger PhenoAge aging acceleration. In cross-sectional analyses, individuals with accelerated aging had higher odds of OA compared to those with non-accelerated aging [Odds Ratios(OR): 1.12(1.09-1.14) for PhenoAge acceleration and 1.05(1.03-1.08) for KDMAge acceleration] (Table 1). In the longitudinal analyses, increased PhenoAge acceleration was associated with a higher risk of incident OA [Hazard Ratios (HR): 1.12(1.10-1.15)]. However, the association between KDMAge acceleration and the incidence of OA was not statistically significant [HR: 0.99(0.97-1.01)]. Accelerated biological aging showed a more pronounced association with OA among individuals >60 years. No additive or multiplicative interactions were found between OA polygenic risk score (PRS) and biological aging.
Conclusions: Advanced biological aging may increase the risk of OA, independent of OA genetic risk, particularly in individuals aged over 60 years old. The two biological aging indicators hold potential as novel composite clinical biomarkers, directing prevention and intervention strategies for high-risk populations for OA.
Association between biological age acceleration and risk of prevalent (Odds ratio) and incident (Hazard ratio) OA
| Odds ratio (95% CI) | Hazard ratio (95% CI) | |||
|---|---|---|---|---|
| Model 1 | Model 2 | Model 1 | Model 2 | |
| PhenoAge acceleration | ||||
| Continuous | 1.02 (1.01, 1.02 ) | 1.02 (1.02, 1.02 ) | 1.02 (1.02, 1.02 ) | 1.02 (1.02, 1.02 ) |
| Phenoge AAsd | 1.08 (1.07, 1.09 ) | 1.08 (1.07, 1.10 ) | 1.08 (1.07, 1.09 ) | 1.08 (1.07, 1.09 ) |
| ≤0 | 1 (reference) | 1 (reference) | 1 (reference) | 1 (reference) |
| >0 | 1.11 (1.09, 1.14 ) | 1.12 (1.09, 1.14 ) | 1.14 (1.11, 1.16 ) | 1.12 (1.10, 1.15 ) |
| Per 5-year | 1.09 (1.07, 1.10 ) | 1.09 (1.08, 1.11 ) | 1.09 (1.08, 1.11 ) | 1.09 (1.08, 1.10 ) |
| Per 10-year | 1.18 (1.15, 1.21 ) | 1.20 (1.17, 1.23 ) | 1.20 (1.17, 1.22 ) | 1.19 (1.16, 1.21 ) |
| KDMAge acceleration | ||||
| Continuous | 1.01 (1.01, 1.01 ) | 1.01 (1.00, 1.01 ) | 1.00 (1.00, 1.01 ) | 1.00 (1.00, 1.01) |
| KDM AAsd | 1.04 (1.02, 1.05 ) | 1.04 (1.03, 1.05 ) | 1.02 (1.01, 1.03 ) | 1.01 (1.00, 1.02) |
| Accelerated aging | ||||
| ≤0 | 1 (reference) | 1 (reference) | 1 (reference) | 1 (reference) |
| >0 | 1.05 (1.02, 1.07 ) | 1.05 (1.03, 1.08 ) | 1.01 (0.99, 1.03) | 0.99 (0.97, 1.01) |
| Per 5-year | 1.05 (1.03, 1.06 ) | 1.05 (1.04, 1.07 ) | 1.02 (1.01, 1.04 ) | 1.01 (1.00, 1.02) |
| Per 10-year | 1.10 (1.06, 1.13 ) | 1.11 (1.07, 1.14 ) | 1.05 (1.02, 1.07 ) | 1.02 (0.99, 1.05) |
Model 1 was adjusted for age, sex, and body mass index.
Model 2 was adjusted for age, sex, body mass index, race, Townsend deprivation index, education level, healthy diet, smoking status, alcohol drinker status, regular physical activity, joint injury, and glucosamine use.
Phenoge AAsd: Phenoage acceleration after standardizing; KDM AAsd: KDMAge acceleration after standardizing.
PhenoAge/KDMAge acceleration aging > 0 were classified as biologically older than chronological age; PhenoAge/KDMAge acceleration aging ≤ 0 were considered biologically younger.
Abbreviations: OA, osteoarthritis; PhenoAge, phenotypic age; KMDAge, Klemera-Doubal method Biological Age.
Bold denotes statistically significant.
REFERENCES: [1] Hunter DJ, Bierma-Zeinstra S. Osteoarthritis. Lancet 2019;393:1745-59.
[2] Hunter DJ, March L, Chew M. Osteoarthritis in 2020 and beyond: a Lancet Commission. Lancet 2020;396:1711-2.
[3] Vina ER, Kwoh CK. Epidemiology of osteoarthritis: literature update. Curr Opin Rheumatol 2018;30:160-7.
[4] Levine ME, Lu AT, Quach A, et al. An epigenetic biomarker of aging for lifespan and healthspan. Aging (Albany NY) 2018;10:573-91.
[5] Klemera P, Doubal S. A new approach to the concept and computation of biological age. Mech Ageing Dev 2006;127:240-8.
Acknowledgments: NIL.
Disclosure of Interests: None declared.