fetching data ... 
Background: Sjögren’s disease (SjD) is a chronic systemic autoimmune disease driven by lymphocytic infiltration of exocrine glands and marked B-cell activation. Therapeutic responses in SjD remain highly variable, even with biologically rational interventions, such as B cell targeted therapies. This variability underscores the need for robust predictive biomarkers for meaningful patient stratification. B-cell targeted therapies, rituximab (RTX, CD20 blockade) and belimumab (BEL-BAFF blockade) alone and in combination, have been evaluated in a phase II trial (NCT02631538, GSK).
Objectives: To explore peripheral blood gene expression signatures predictive of sustained clinical response to B-cell-targeted therapies, administered alone or in combination, and define molecular pathways underlying therapeutic response and resistance.
Methods: Whole-blood RNA sequencing was performed in 37 adults with active SjD (ESSDAI ≥5) randomised (1:1:1) to receive rituximab (RTX, n=13), belimumab (BEL, n=12) or combined BEL+RTX (n= 12) therapy. Peripheral blood samples were collected at baseline. Sustained clinical response was defined as an improvement of ≥3 points in ESSDAI at week 52 (end of the trial), classifying patients as responders (n=26) or non-responders (n=11). Differential gene expression analyses at baseline were conducted using DESeq2, with significance thresholds set at p < 0.01 and fold change (FC) >1.5. Functional enrichment analysis was performed using Metascape.
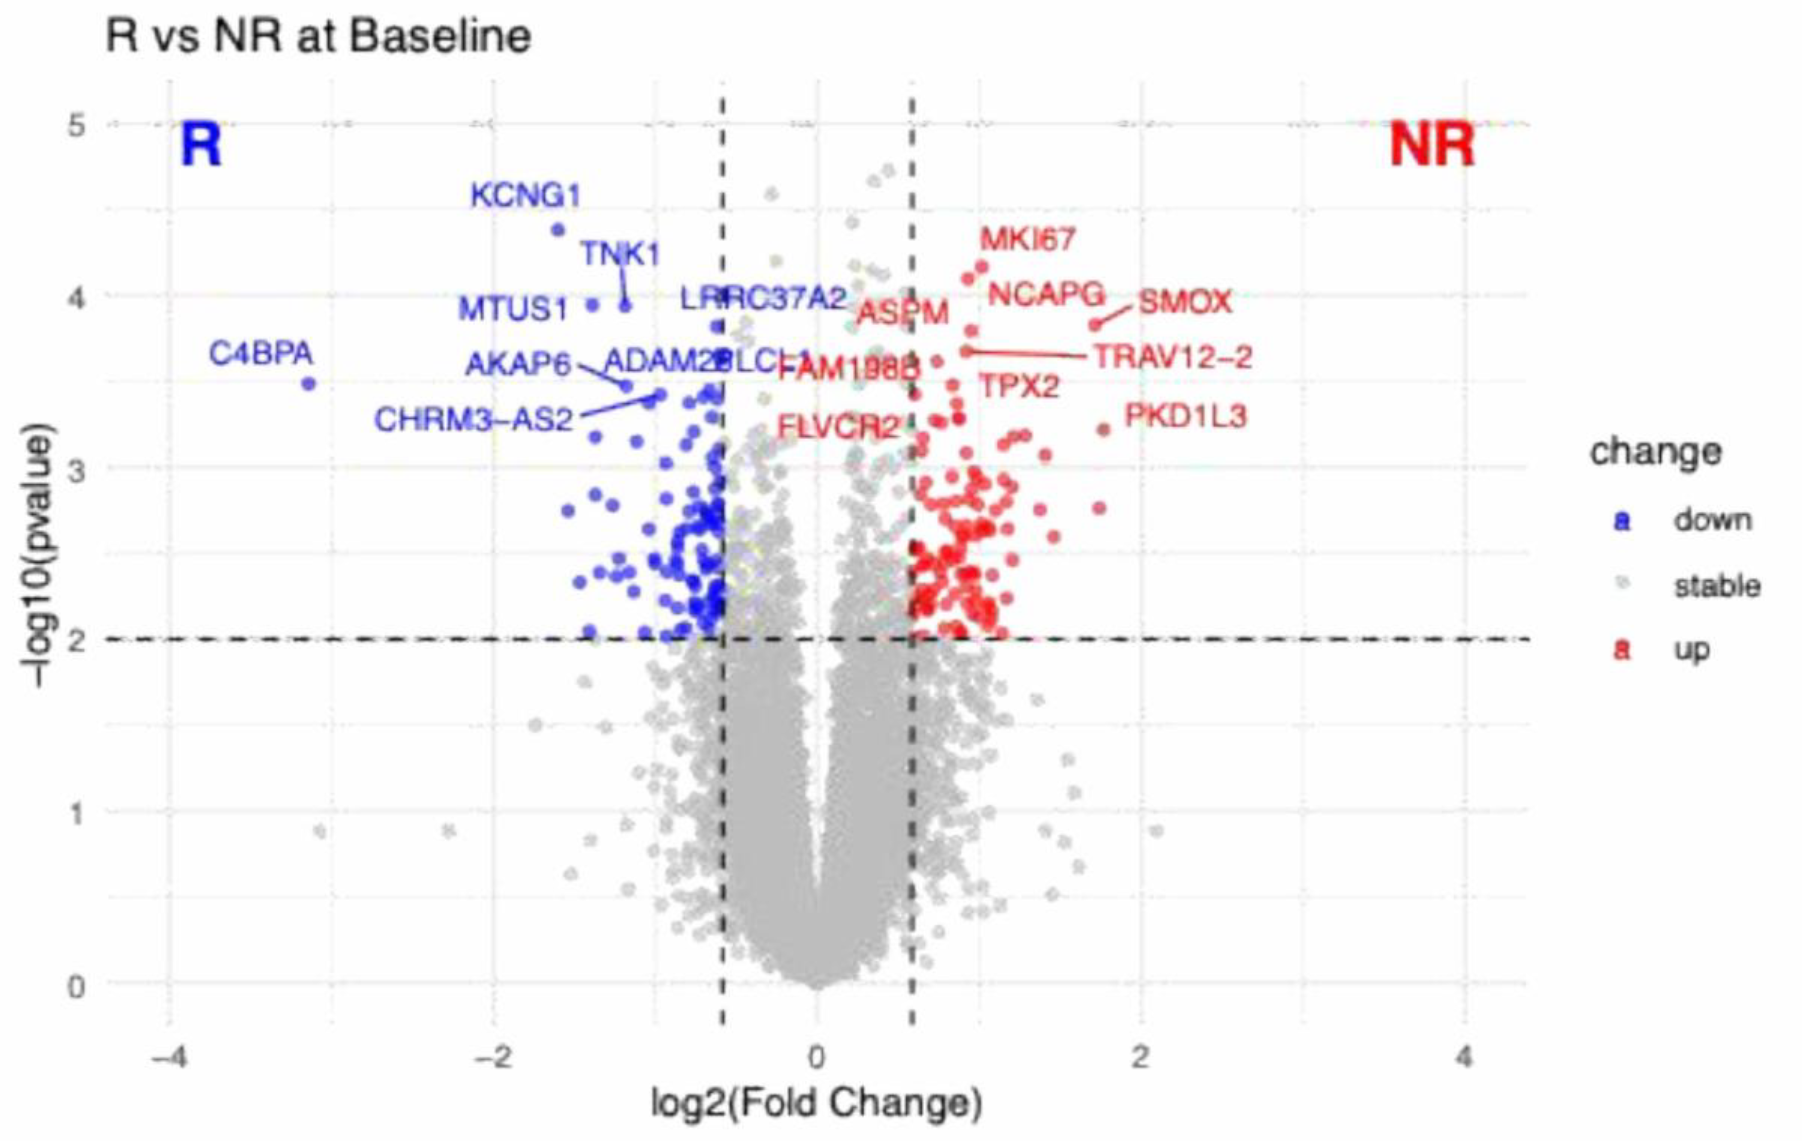
Results: At baseline, comparison between patients stratified based on response at week 52 across all treatment arms identified a distinct peripheral blood gene expression signature associated with clinical response (Figure 1). A total of 199 significantly differentially expressed genes (DEGs, p < 0.01, |FC| > 1.5), 105 upregulated and 94 downregulated, were detected in non-responders compared with sustained responders to B-cell-targeted therapies.
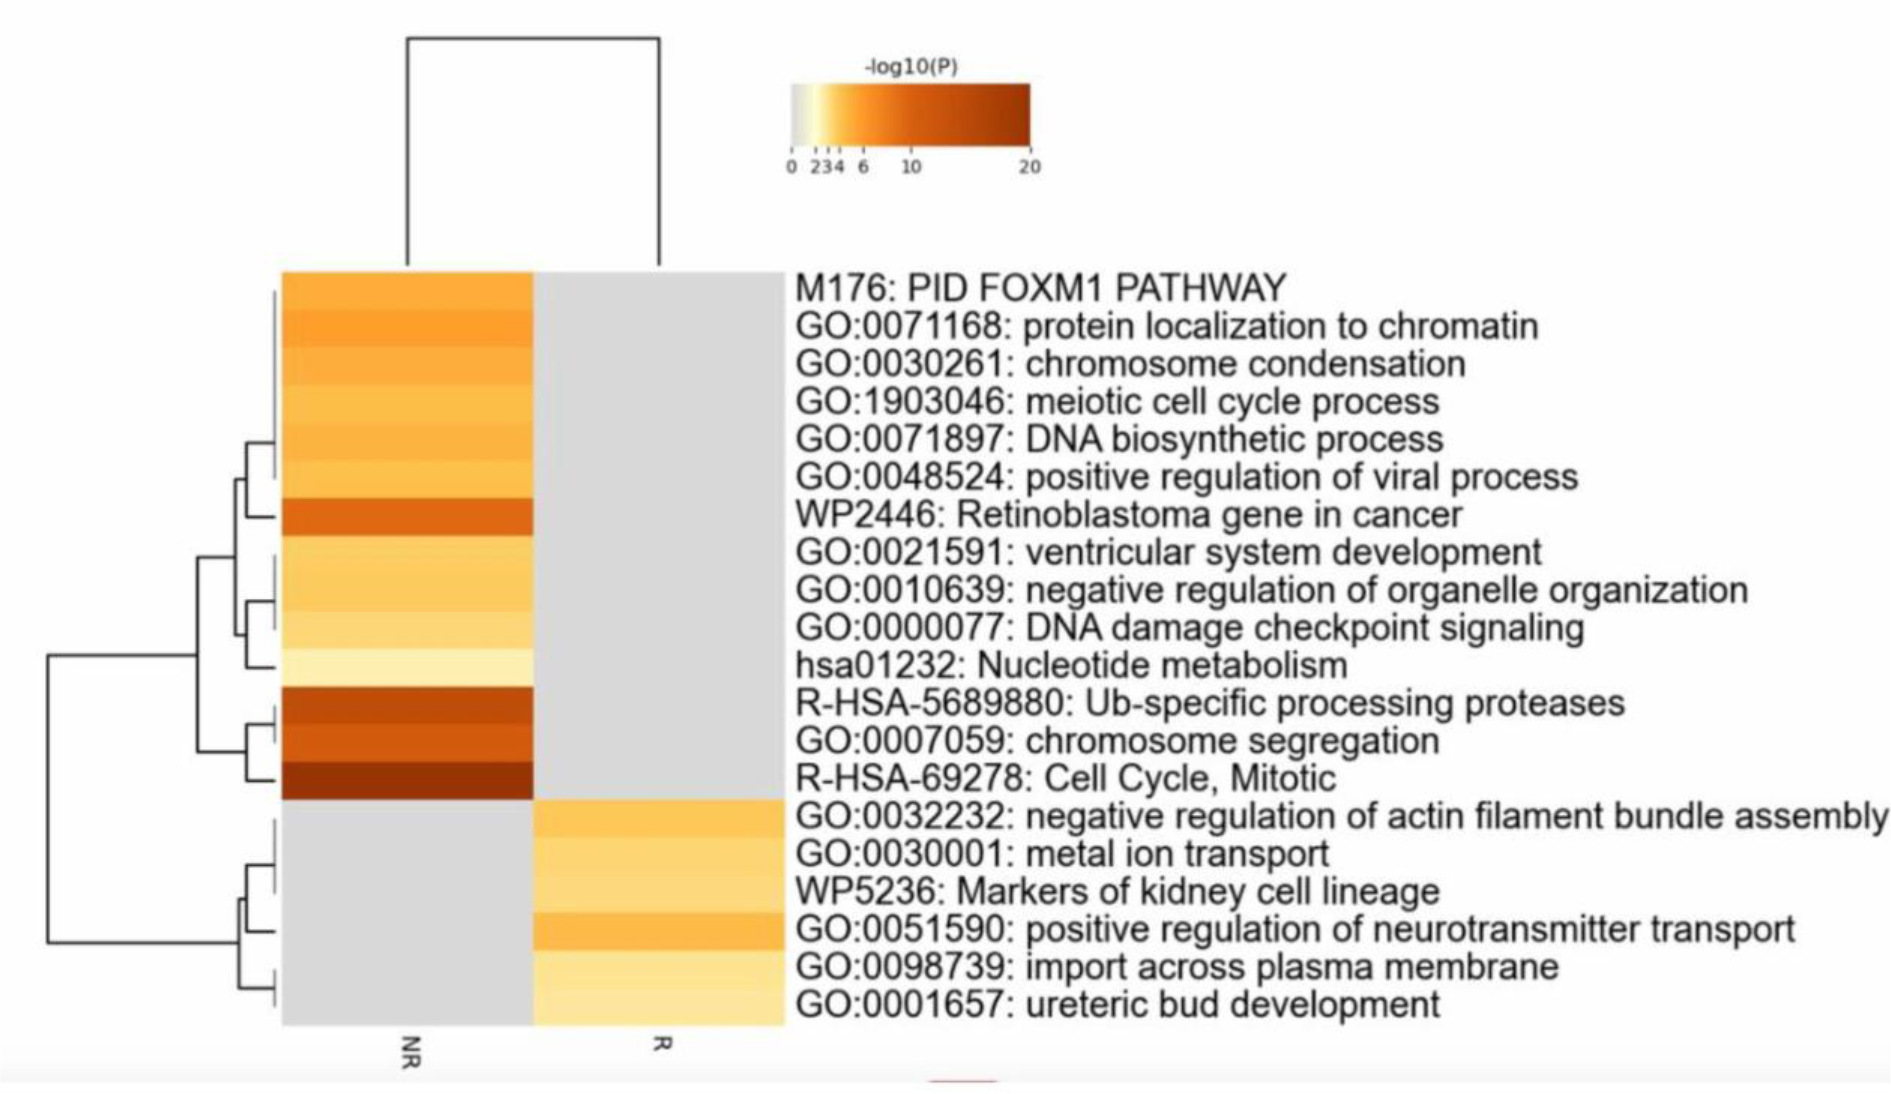
At baseline, genes upregulated in non-responders were enriched for markers associated with cellular proliferation and immune activation, including MKI67, TPX2, NCAPG and ASPM, whereas genes relatively overexpressed in responders included immune-related and regulatory transcripts such as C4BPA and TNK1. Notably, non-responders also exhibited a pre-existing hyperproliferative molecular state, whereas responders showed a more regulated immune transcriptomic signature prior to therapy commencement. Pathway enrichment analysis performed on the n=94 DEGs upregulated in responders and n=105 DEGs upregulated in non-responders revealed marked biological differences at baseline (Figure 2). These differences were characterised by strong enrichment of pathways associated with cell-cycle regulation and proliferative signalling in non-responders, consistent with a transcriptional profile dominated by sustained cellular activation. In contrast, DEGs in patients responding to therapy at week 52 were enriched in pathways linked to cellular transport and cytoskeletal organisation, reflecting a more regulated immune transcriptomic landscape.
Conclusions: This exploratory analysis, leveraging samples and data from the only RCT in SjD evaluating RTX and BEL alone and in combination, identified baseline molecular programmes associated with long-term clinical outcomes. Non-response was characterised by a proliferative, cell-cycle–driven signature at baseline. In contrast, treatment response was linked to transcriptomic pathways governing cellular architecture and trafficking rather than proliferative activation, suggesting a baseline molecular environment more amenable to modulation by B-cell–targeted therapies. These baseline differences require further validation in independent cohorts to determine their value for future patient stratification.
Differential gene expression between responders and non-responders at baseline. Volcano plot showing differential gene expression between responders (R) and non-responders (NR) at baseline. Each point represents one gene, plotted according to its log2 fold change (x-axis) and -log10(p-value) (y-axis). Genes with higher expression in responders are shown in blue, and genes with higher expression in non-responders are shown in red, based on thresholds of |log2 fold change| ≥ 0.585 and p-value ≤ 0.01. Non-significant genes are shown in grey.
Functional pathway enrichment of baseline differentially expressed genes. Heatmap showing enriched biological pathways based on baseline differentially expressed genes between R and NR. Colour intensity represents pathway significance expressed as -log10(p-value), with darker shades indicating higher statistical significance.
REFERENCES: NIL.
Acknowledgments: NIL.
Disclosure of Interests: Aimen Ibrahim: None declared, Junjie Peng: None declared, Baihe Tian: None declared, George Robinson: None declared, Lucia Martin-Gutierrez GSK, John Casement: None declared, Kyle Thompson: None declared, Wan-Fai Ng GSK, Andre van Maurik GSK, GSK, Elizabeth Jury GSK, Coziana Ciurtin GSK.