fetching data ... 
Background: Despite effective drugs for Rheumatoid Arthritis (RA), about 40% of patients do not respond to the first line of treatment. The heterogeneity of the inflamed synovium in RA can be classified into three pathotypes – lympho-myeloid, diffuse-myeloid and pauci-immune – defined by the presence and spatial organisation of immune cells, and linked to different disease evolution and treatment responses. Recently, transcriptomic signatures linked with fibroblasts were associated with poor response, yet histological analysis of synovial fibroblasts is challenging, because of the lack of specific markers, their elongated cellular morphology, and heterogeneity in their expression patterns across synovial regions.
Objectives: We aimed to assess synovial sublining fibroblasts in a treatment-naïve RA cohort, analysing their presence across synovial pathotypes and their changes in relation to treatment response using conventional histology integrated with deep learning-based approaches.
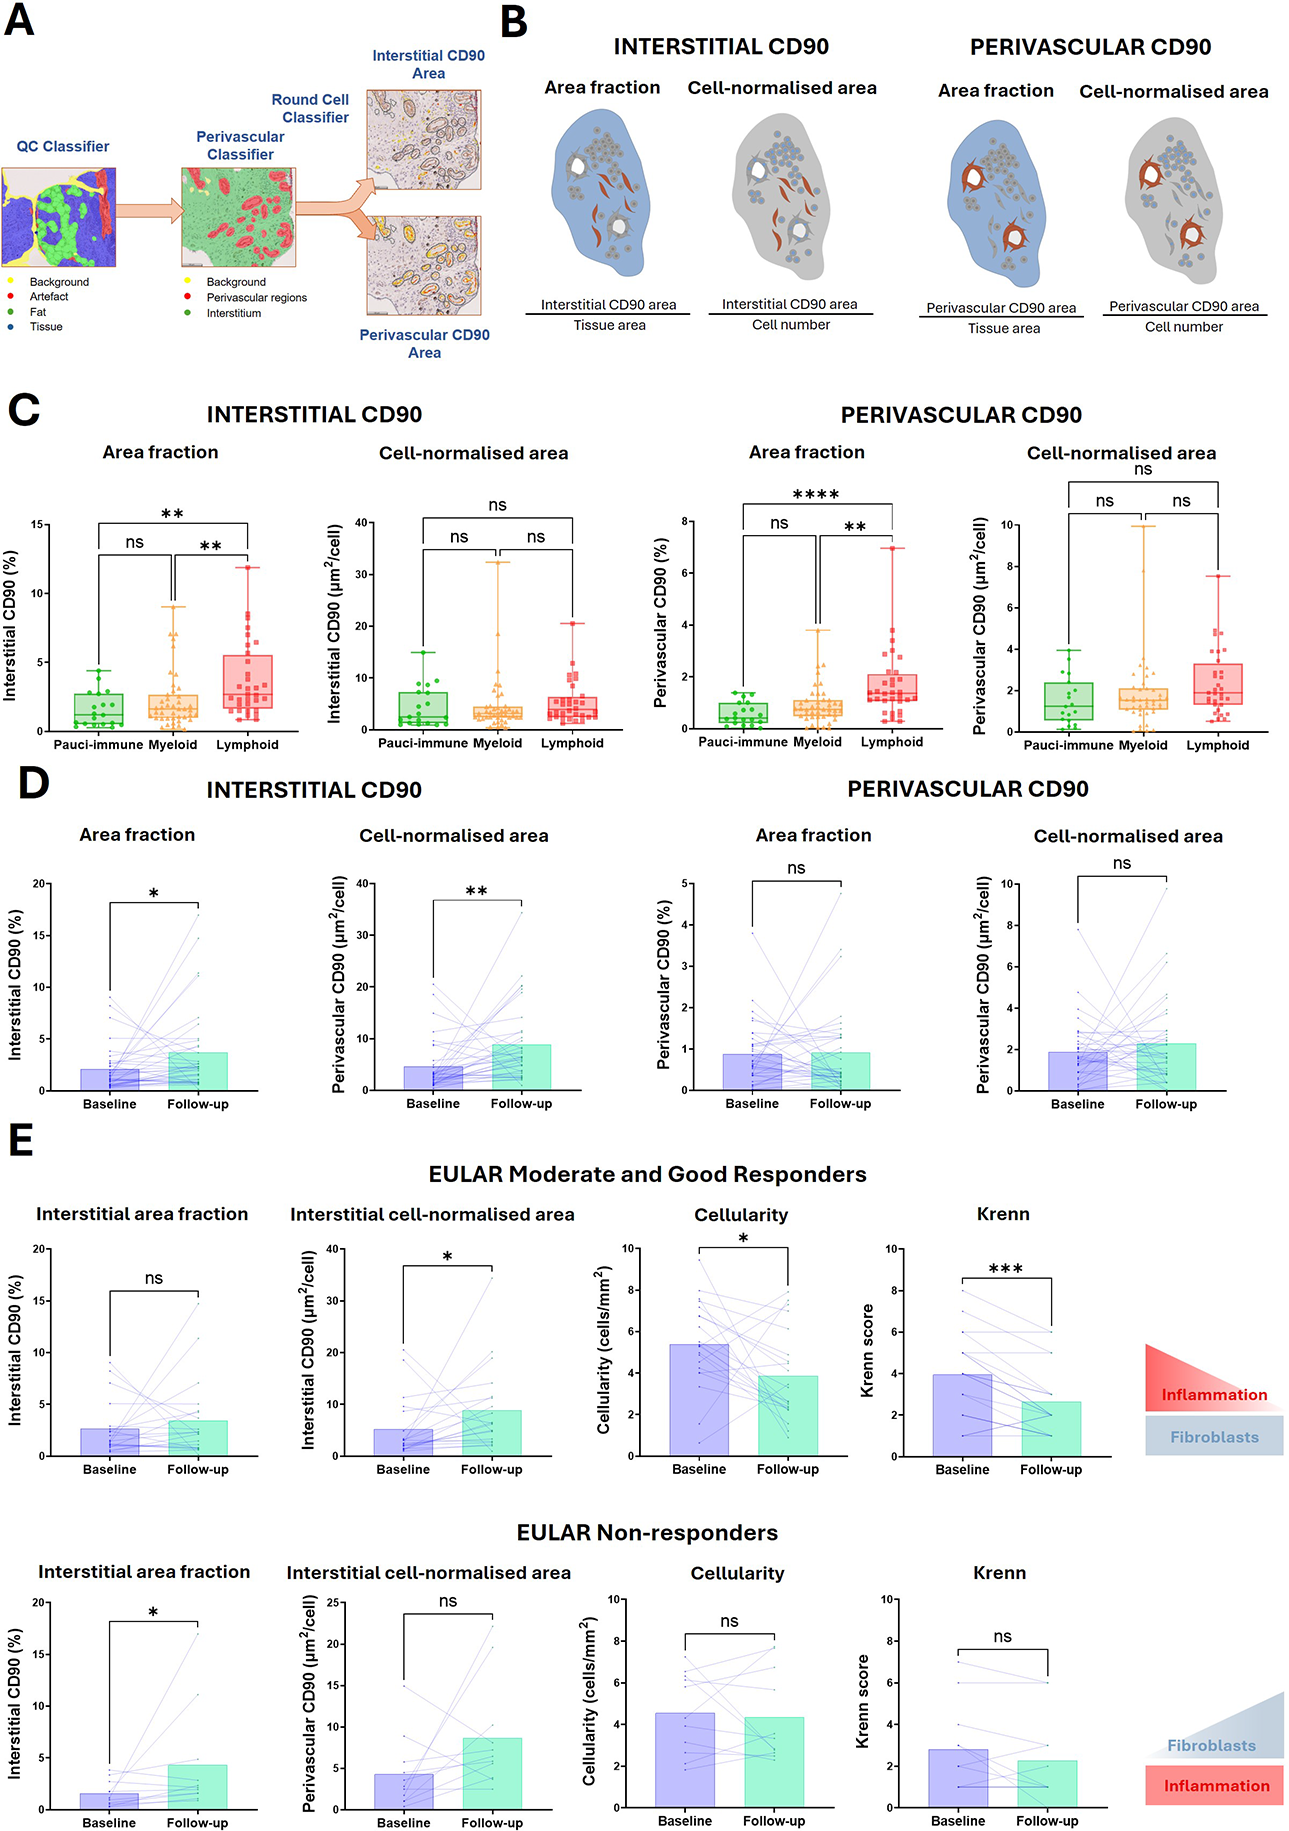
Methods: Formalin-fixed paraffin-embedded synovial biopsies from a cohort of treatment-naïve RA patients ( n = 94) and matched synovial samples after 6 months of treat-to-target treatment with csDMARDS ( n = 31) ( Table 1 ), were stained for the sublining fibroblast marker CD90 and analysed using the deep learning-based platform HALO AI. After manual segmentation of the synovial tissue, three classifiers were trained and applied sequentially to: (i) exclude fat, background and artifacts; (ii) differentiate between perivascular and interstitial regions; (iii) exclude round cells, likely to be lymphocytes/monocytes ( Figure 1A ). Interstitial and perivascular CD90 scores were calculated by either normalising the CD90 signal by tissue area or total cell count ( Figure 1B ). Cellularity was quantified as the number of cells normalised to tissue area. Tissues were also categorised into inflammatory pathotypes – according to the expression of CD68, CD3, CD20 and CD138, semi-quantitatively assessed on a scale 0-4 – and scored according to the Krenn synovitis score.
Results: Histological analysis showed a gradient of CD90 expression across the synovium, stronger in perivascular regions and weaker in the interstitium. Deep learning-driven analysis allowed to differentiate cells in both compartments, revealing that, within treatment-naïve patients, interstitial and perivascular CD90 scores were significantly higher in the lympho-myeloid pathotype when normalised by tissue area, but similar across pathotypes when normalised by cell count ( Figure 1C ). Upon treatment with csDMARDs, interstitial CD90 scores increased significantly, with no changes in perivascular CD90 ( Figure 1D ). Crucially, stratification by EULAR response criteria at 6 months revealed different mechanisms, non-responders had significantly increased interstitial CD90 + area fraction after treatment with unchanged cellularity or Krenn score. Conversely, moderate/good responders showed increased interstitial CD90 + cells relative to other cells (cell-normalised), paralleled by a significant reduction in the overall cellularity and Krenn synovitis score ( Figure 1E ).
Conclusions: We validated a deep learning-based approach that overcomes histological challenges to accurately map fibroblast heterogeneity in synovia, discriminating between distinct regions of CD90 expression. In treatment-naïve RA, the elevated CD90 area fraction observed in lympho-myeloid pathotypes appears to reflect the dense cellularity and vascularisation characteristic of high-inflammation states, rather than a specific stromal phenotype shift. However, longitudinal analysis revealed two distinct fibroblast dynamics. In moderate/good responders, the relative increase in interstitial CD90 + cells likely reflects an enrichment in the proportion of stromal cells as inflammation resolves. In contrast, non-responders exhibit a newly expanded interstitial CD90 + cells population alongside persistent inflammation. These results suggest that a de novo expansion of interstitial CD90 + fibroblasts may represent a specific driver of treatment resistance.
Table 1. Clinical characteristics of the treatment-naïve RA cohort with paired baseline and follow-up biopsies.
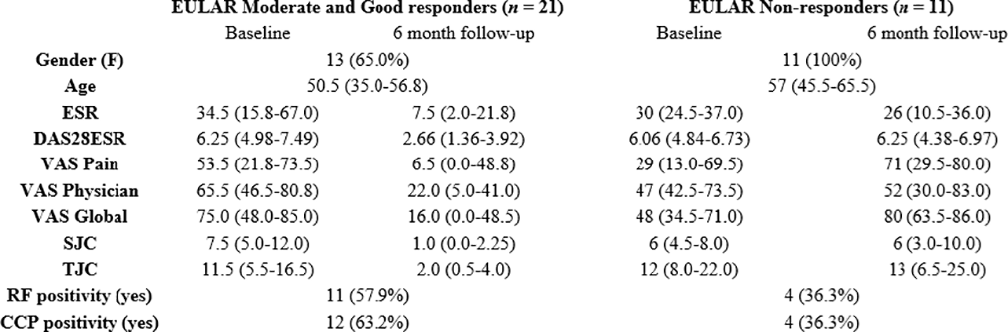
ESR: Erythrocyte Sedimentation Rate;
DAS28: Disease Activity Score 28;
VAS: Visual Analogue Scale;
SJC: Swollen Joint Count;
TJC: Tender Joint Count;
RF: Rheumatoid Factor;
CCP: Cyclic Citrullinated Peptide Antibody.
Heterogeneity of CD90 expression in the RA synovium across pathotypes and response groups. CD90 immunohistochemical staining of synovial biopsies was quantified using a quality control (QC) classifier, a perivascular classifier, and a round-cell classifier ( A ). CD90 expression in interstitial and perivascular regions was assessed by either normalising the CD90-positive area by the total tissue area (area fraction) or by total number of cells (cell-normalised area) ( B ). CD90 expression scores were compared in a cohort of treatment-naïve patients across pathotypes ( C ) and 6 months after csDMARD treatment ( D ). Patients were stratified according to EULAR response, with interstitial CD90 expression, cellularity and Krenn score compared between baseline and 6-month follow-up ( E ). * = p ≤ 0.05; ** = p ≤ 0.01; *** = p ≤ 0.001; **** = p ≤ 0.0001
REFERENCES: NIL.
Acknowledgments: NIL.
Disclosure of Interests: None declared.