fetching data ... 
Background: Three distinct histopathological pathotypes have been established in new-onset rheumatoid arthritis (RA) cohorts – lympho-myeloid (LM), diffuse myeloid (DM) and pauci-immune/fibroid (PI) - using ultrasound (US) guided biopsy fragments [1]. Establishing an accurate pathotype may have implications for prognosis and treatment response, although heterogeneity in synovial inflammation across a joint and technical limitations of US guided sampling limit diagnostic accuracy of individual fragments. Arthroscopic approaches, though more invasive, may overcome these limitations due to direct visualisation of synovial tissue (ST) to obtain larger fragment sizes. For high-throughput techniques, such as spatial transcriptomics, selecting the appropriate representative fragment is critical for accurate interpretation.
Objectives: To enable accurate histopathological pathotyping and selection of fragments for analysis using high throughput techniques, we aimed to assess variability within individual new-onset RA patients by:
Using conventional histological and immunohistochemistry (IHC) approaches to determine the minimum number of fragments required to accurately assign a ST pathotype, and whether fragment size influences this assignment
Using spatial transcriptomics to determine variability between fragments with regards to cell type proportions, gene expression and cell-cell proximity
Methods: We included ST biopsy samples from 12 knee arthroscopies (9 RA, 3 normal controls) and excluded fragments lacking a synovial lining layer. Haematoxylin & eosin (H&E) fragments were assessed by reviewers blinded to patient identity and overall pathotype, who assigned a histological pathotype to each fragment and to 6 high-powered field (HPF) regions of interest (ROI) within each fragment. We assigned a final pathotype to unblinded biopsies (including all assessable fragments) combining H&E and CD3, CD68, CD138, CD20 IHC. We used agreement and heterogeneity metrics (pairwise agreement, modal proportion, entropy), and learning-curve analysis to determine within-patient fragment concordance using and the minimum number of fragments required for accurate pathotype assignment. We used a binomial generalised linear mixed-effects model to evaluate the association between fragment size (per 1mm 2 increase) and fragment level agreement. To determine reliability of assigning a pathotype using whole fragment versus HPF ROI, we compared fragment/HPF ROI level accuracy to the final pathotype using Cohen’s kappa coefficient (. We compared median sizes of correctly and incorrectly classified fragments and HPF ROIs to evaluate the effect of fragment size on reliability. We analysed 18 fragments from 7 RA patients imaged with Xenium spatial transcriptomics (human 5k panel), quantifying cellular composition, gene expression variability and cellular distance shifts (all combinations of cell-type pairs) to determine variability between fragments.
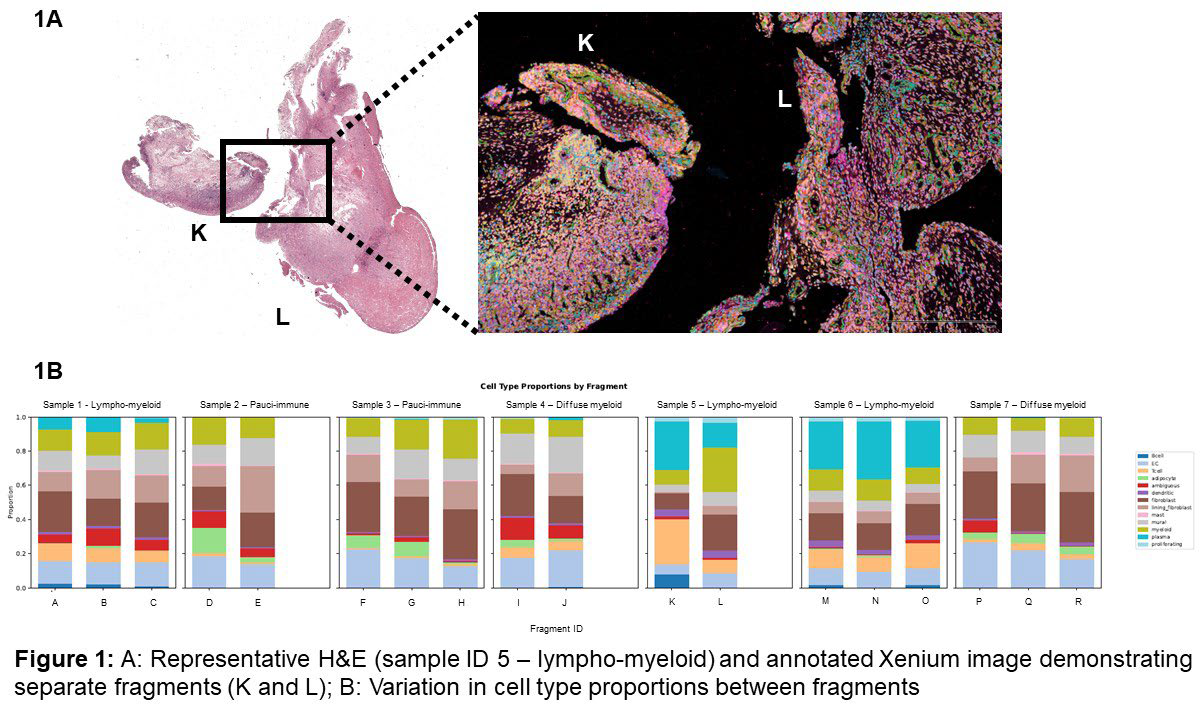
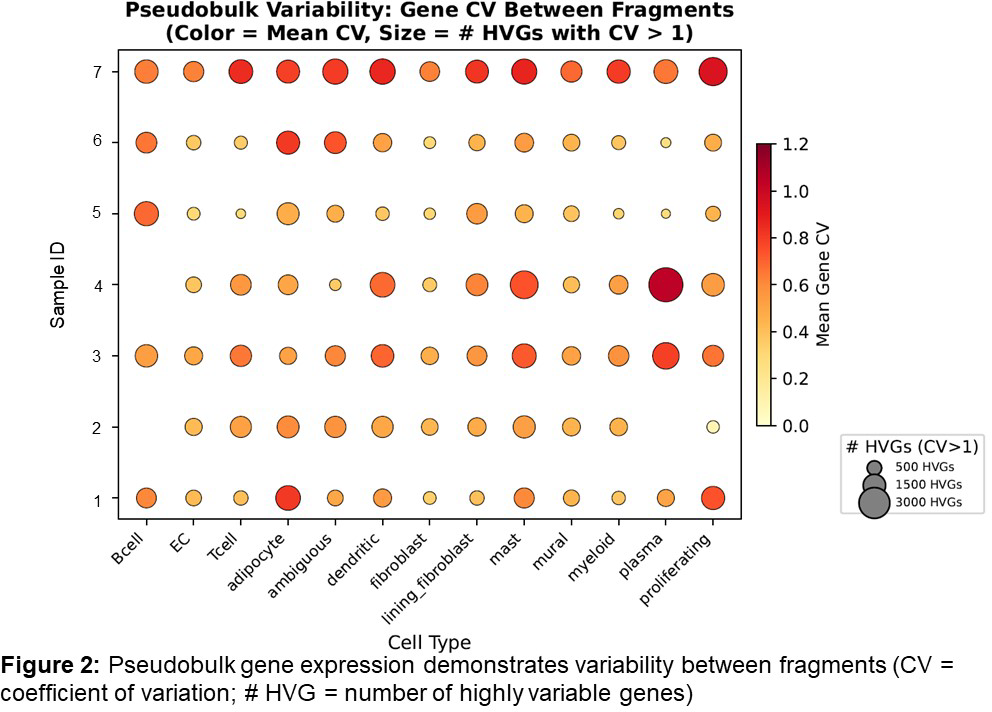
Results: Ninety-one fragments were scanned from 12 arthroscopies (9 RA, 3 healthy controls), and 86 assessable fragments were included in the final analysis. Median fragment size was 5.96mm 2 (IQR 3.38mm 2 – 8.44mm 2 ). The LM pathotype had high within-patient agreement of fragment pathotype (median pairwise agreement 0.83; modal proportion 0.92; entropy 0.41), compared to DM and PI pathotypes (DM: 0.32, 0.50, 1.41; PI: 0.52, 0.71, 0.86, respectively). A minimum of 10 fragments was required to achieve 90% diagnostic accuracy across all pathotypes. LM patients required fewer fragments (n=3) to achieve diagnostic accuracy compared to DM (n=10); neither PI nor healthy tissues achieved 90% diagnostic accuracy. Larger fragments showed a trend towards greater accuracy in assigning pathotypes (OR/1 mm 2 increase=1.16, 95% CI 0.97–1.38, p=0.11), and assigning a pathotype based on the whole fragment (=0.377) was more reliable than using HPF ROI (=0.296). For LM and DM, selecting a fragment size of >4.50mm 2 had greater diagnostic accuracy compared to PI or healthy tissues (median size of accurately matched fragments 4.50mm 2 (IQR 3.35 – 9.82mm 2 ) and 5.06mm 2 (IQR 4.28 – 8.61mm 2 ) respectively). Across fragments from individual tissues that were spatially imaged using Xenium transcriptomics, there was heterogeneity for cell-type proportions (figure 1A and 1B) and gene expression (figure 2). Significant regional variation was observed between fragments: median significant cell-type pair (e.g.: T cell-->fibroblast, myeloid-->mural) and distance shifts ranged from 9.29% - 50.35% and 2.82mm – 8.12mm, respectively.
Conclusions: Within an individual RA patient, there is significant ST heterogeneity when assessed by histology, cellular composition, gene expression or cell-cell distance. Our data emphasises the importance of selecting a pathotype-appropriate number of representative ST samples, particularly when using high-throughput techniques.
REFERENCES: [1] Humby F, Lewis M, Ramamoorthi N, Hackney JA, Barnes MR, Bombardieri M, et al. Synovial cellular and molecular signatures stratify clinical response to csDMARD therapy and predict radiographic progression in early rheumatoid arthritis patients. Ann Rheum Dis. 2019 Jun;78(6):761–72.
Acknowledgments: NIL.
Disclosure of Interests: None declared.