fetching data ... 
Background: Neuropsychiatric systemic lupus erythematosus (NPSLE) is a severe complication of SLE, yet its pathogenic mechanisms remain incompletely understood. Cerebrospinal fluid (CSF) plays a critical role in the research and diagnosis of central nervous system (CNS) diseases. CSF single-cell studies have been applied in several CNS diseases, providing insights into disease mechanisms and potential clinical applications. However, to date, single-cell profiling of CSF in NPSLE has not been systematically performed. Moreover, the extremely low cellularity of CSF and the limited sample sizes pose major challenges for identifying disease-relevant immune cell populations and molecular signatures in NPSLE.
Objectives: To characterize the immune microenvironment dynamics for NPSLE and other CNS diseases by integrating single-cell RNA and TCR sequencing data from CSF and blood, and to compare NPSLE-specific CSF immune features with those of healthy controls (HCs).
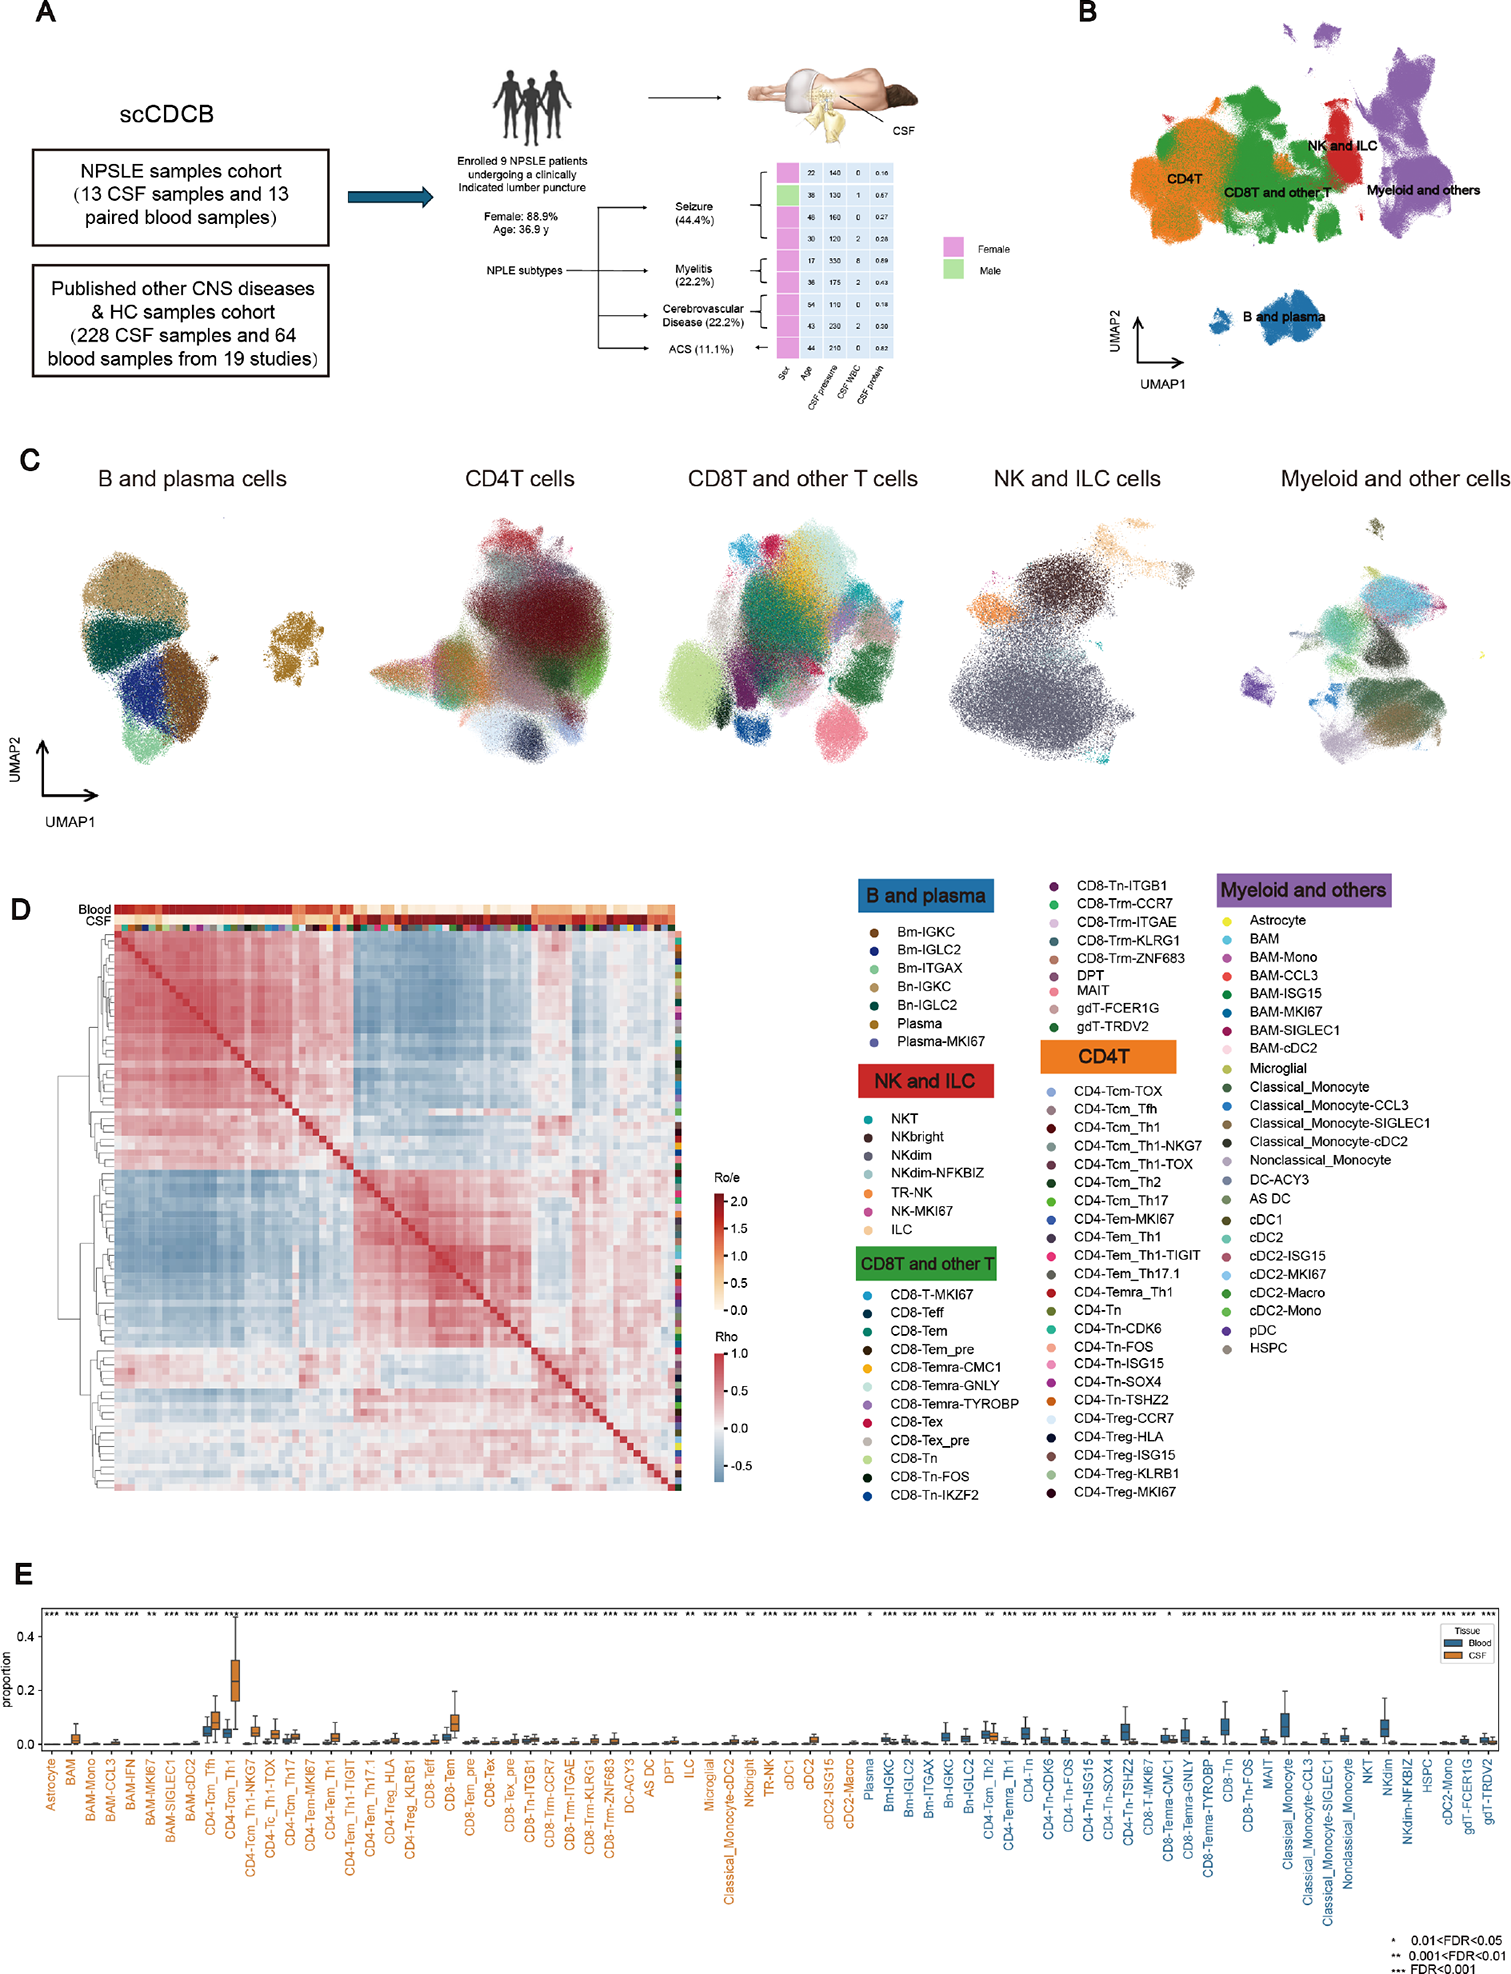
Methods: We collected CSF samples from 11 patients with SLE at Peking Union Medical College Hospital (PUMCH). Among them, nine patients had NPSLE during active disease episodes (Figure 1A), including one patient from whom serial CSF samples were obtained at three time points. In addition, one patient had NPSLE in sustained remission, and one patient had SLE without CNS involvement. In total, 13 paired CSF and blood samples were collected. Furthermore, we gathered 19 published studies, comprising 228 CSF samples and 64 blood samples from cohorts of other CNS diseases and HCs. By intergrating single-cell RNA and TCR sequencing across paired CSF and blood samples, we constructed, to our knowledge, the largest single-cell CNS Disease atlas for CSF–Blood data (scCDCB) to date.
Results: After strict quality control, a total of 1,142,369 cells were retained, composed of 611,224 PBMCs and 531,145 CSF cells, and subsequent integration across all samples in the scCDCB atlas produced 82 cell types (Figure 1B, C). To characterize the overall differences of the immune microenvironment, we computed the immune cell composition for each individual and observed pronounced heterogeneity between the blood and CSF immune microenvironments at the atlas level (Figure 1D, E). While blood T cells are primarily naïve and terminally differentiated phenotypes, their CSF counterparts predominantly exhibit memory or effector phenotypes. In particular, the CSF enrichment in Tcm cells and Tem cells, two cell types characterized by long time immunological memory and rapid recall responses, reflects a CSF immune landscape that is more oriented toward immune surveillance and regulation.
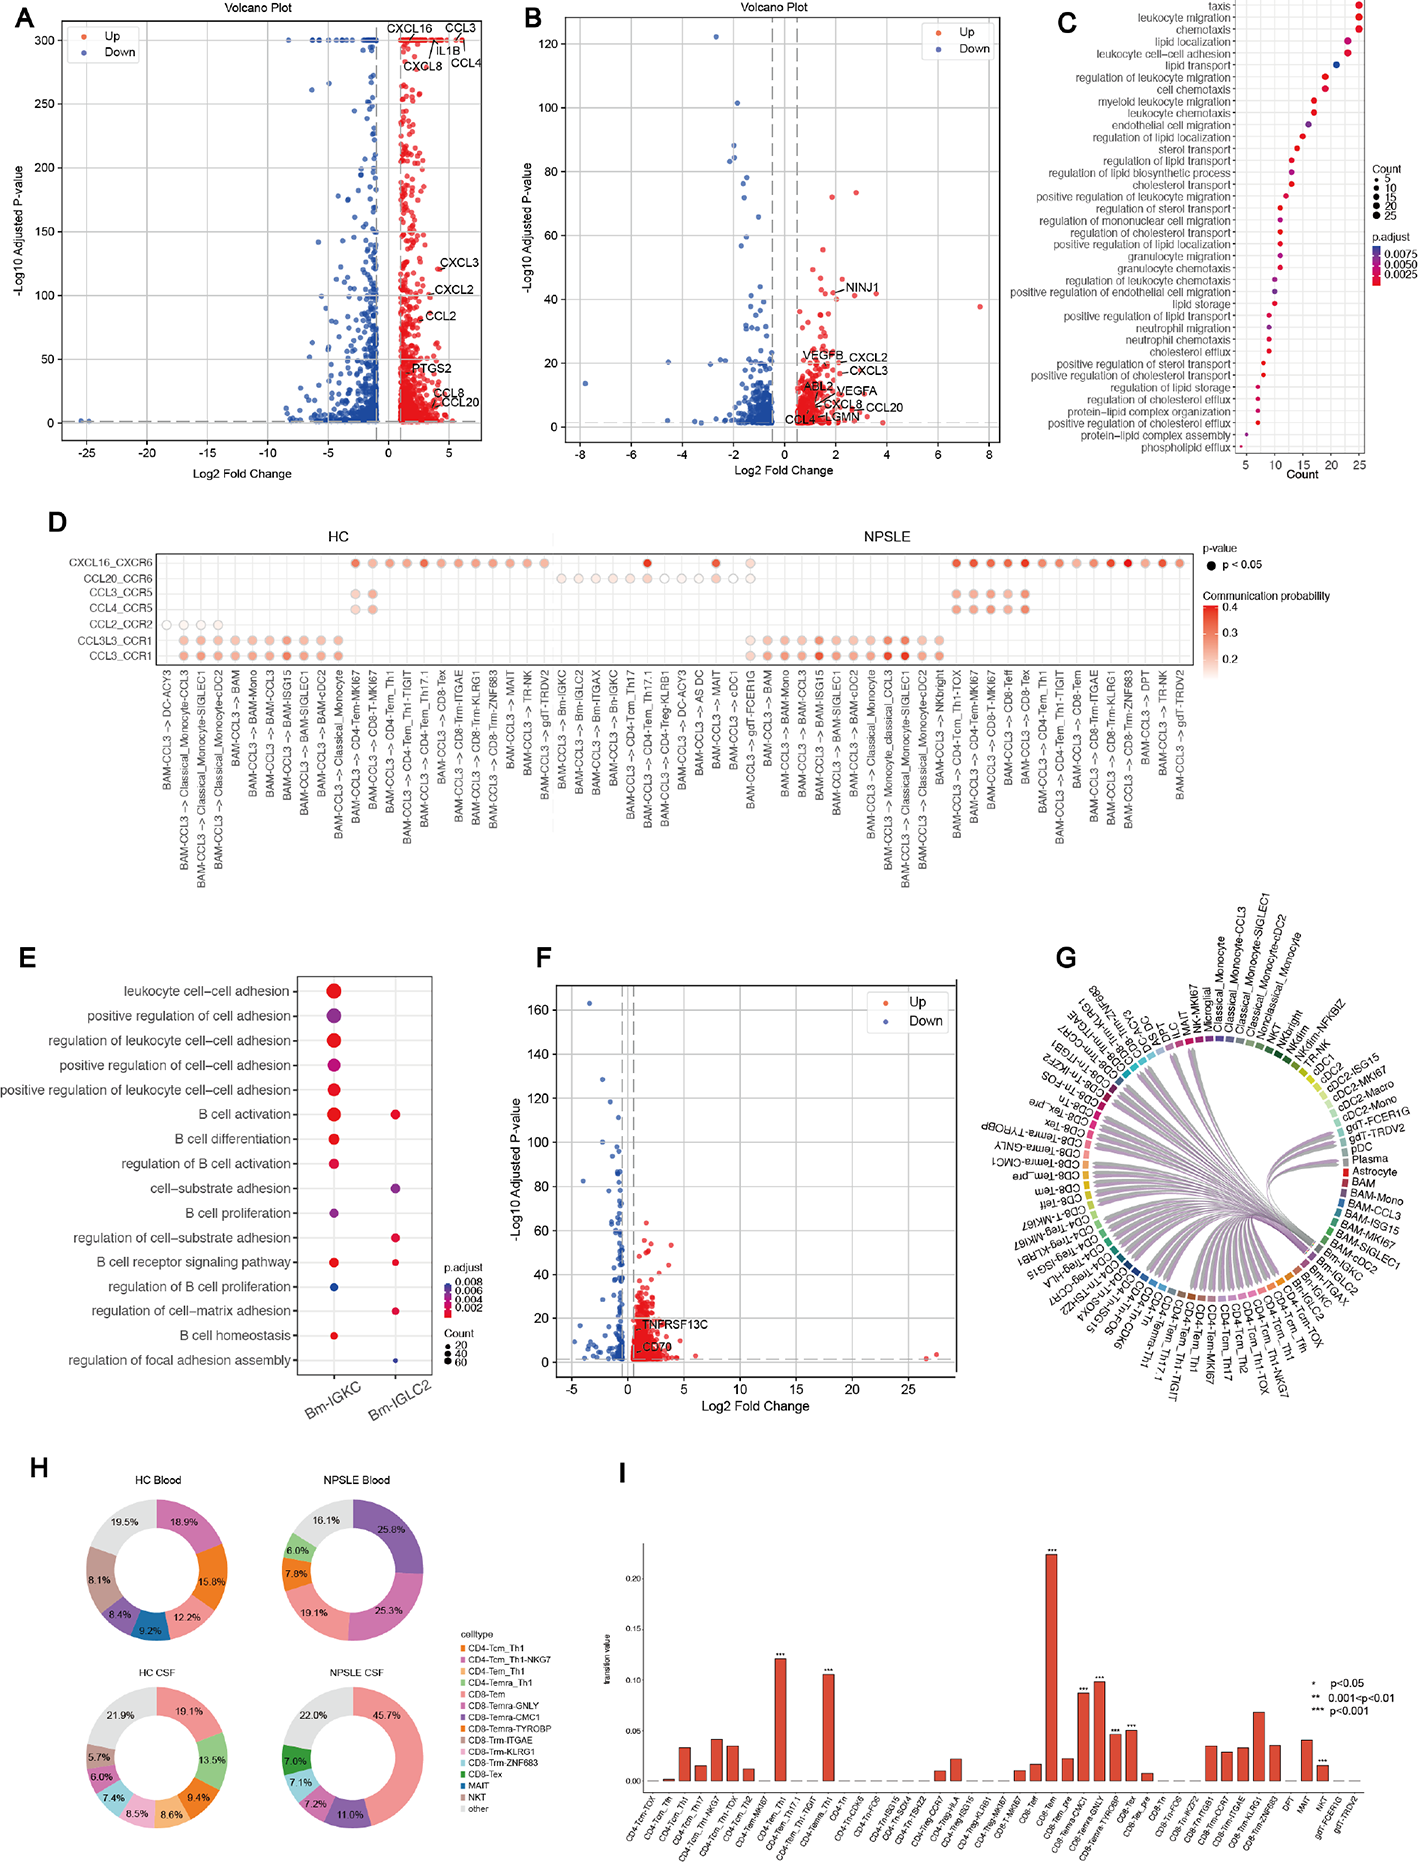
Furthermore, compared with HCs, we identified a marked enrichment of CCL3-expressing border-associated macrophages (BAM-CCL3), a distinct BAM subtype previously unrecognized in the CSF of patients with NPSLE. BAM-CCL3 exhibits a strong pro-inflammatory transcriptional profile, with high expression of chemokines and cytokines (Figue 2A). In NPSLE, these pro-inflammatory features are further enhanced, along with upregulation of VEGF family genes that may promote endothelial activation and increased BBB permeability (Figure 2B, C). Cell–cell communication analyses indicate that BAM-CCL3 can recruit multiple immune cell subsets through distinct chemokine–receptor axes (Figure 2D), suggesting a central role for BAM-CCL3 in driving CNS inflammation in NPSLE.
In NPSLE patients, two memory B cell subsets Bm-IGLC2 and Bm-IGKC are proportionally increased and exhibit an activated immune response state compared with HCs (Figure 2E). This activation is associated with enhanced BAFF and APRIL signaling and upregulation of TNFRSF13C (Figure 2F). Activated memory B cells also show increased CD70 expression and engage the CD70–CD27 axis to regulate T and B cells (Figure 2F, G), possibly affecting their survival and activation and ultimately exacerbating CNS inflammation.
Finally, we use single-cell TCR sequencing data to identify characteristic clonal patterns of T cells in NPSLE CSF. We found that, clonally expanded T cells in NPSLE CSF still display a strong enrichment in CD8Tem cells rather than no particular enrichments for HC CSF T cells, and also distinguish themselves from blood-expanded T cells that are mostly CD8Temra-biased (Figure 2H). In line with this, NPSLE CD8Tem cells have the strongest blood-CSF migratory capacity than other T subtypes (Figure 2I).
Conclusions: These findings highlight the unique composition of immune cells in NPSLE CSF and provide a reference for the development of targeted therapies for NPSLE as well as for research on other CNS diseases.
scCDCB and immune microenvironment composition
A. Establishment of the scCDCB. B. UMAP plot showing the major cell types, colors represent different cell populations. C. UMAP plot showing the subtypes. D. The heatmap of the Spearman’s correlation coefficients (ρ) on cell type proportions between different patients, with the top two-color bars showing the distribution of the ratio of enrichment (Ro/e) for each cell type across blood and cerebrospinal fluid compartments. E. Paired Wilcoxon rank-sum tests using the cell type proportions from paired blood and CSF samples.
DEG, pathways and interactions enriched in NPSLE CSF immune subsets
A. DEGs of BAM-CCL3 relative to other myeloid cells. B. DEGs of BAM-CCL3 in NPSLE CSF relative to HC CSF. C. The enriched pathways of the upregulated DEGs of BAM-CCL3 in NPSLE CSF relative to HC CSF. D. Distribution of communication probabilities of axes involving different CCL and CXCL chemokines sent out by BAM-CCL3, p<0.05. E. The enriched pathways of the upregulated DEGs of Bm-IGKC and Bm-IGLC2 in NPSLE CSF relative to HC CSF. F. DEGs of Bm-IGKC and Bm-IGLC2 in NPSLE CSF relative to HC CSF. G. CD70-CD27 signaling pathway send out by Bm-IGKC and Bm-IGLC2 in NPSLE. H. The ratio of each cell type in the clonally expanded T cells in CSF and blood of NPSLE and HC patients. I. STARTRAC-based migratory capacities of different cell types across NPSLE CSF and blood.
REFERENCES: NIL.
Acknowledgments: NIL.
Disclosure of Interests: None declared.