fetching data ... 
Background: Patient-derived Disease Activity Score (PDAS) was developed to allow rheumatoid arthritis (RA) patients to self-assess without the need of evaluator. Two versions, PDAS1 with ESR (erythrocyte sedimentation rate) and PDAS2 without, had been validated and shown to correlate well with DAS28 and display responsiveness to change in patients put on disease-modifying drugs. PDAS has the potential to inform disease activity change between evaluator’s assessments and/or blood tests. This would be a useful monitoring tool to deliver treat-to-target tight RA control.
PDAS1=0.019×(PGA out of 100)+0.842×ln(ESR +2)+0.432×ln(patient 50 TJC +2)+0.271×HAQ
PDAS2=2.667+0.021×(PGA out of 100)+0.483×HAQ +0.033×(patient 28 SJC)+0.002×(EMS in minutes) whereas PGA=patient global assessment, TJC=tender joint count; SJC=swollen joint count; HAQ=Health Assessment Questionnaire; EMS=early morning stiffness
Objectives: To assess whether PDAS is sensitive to change for an evaluator-based flare and improvement and whether PDAS1 (with ESR) is better than PDAS2.
Methods: A prospective cohort of 92 RA patients completed PDAS1 and 2 scores at the first and second clinic visits in a tertiary referral rheumatology centre. Flare was taken as increased RA activity from Simplified Disease Activity Index (SDAI) (remission or low activity) at the 1 st visit → (moderate or high activity) at the 2nd visit, while improvement was the reverse change. Overall changes (Δ) of SDAI and PDAS1 and 2, in both directions, between these two visits were correlated using Spearman correlation coefficients. Further subgroup analysis (flare and improvement) was done by comparing the magnitude of changes between SDAI and PDAS1 and 2 using Mann-Whitney U test.
Results: Mean age of the cohort was 60 years, mean RA duration 14 years, 90% female, 71% sero-positive, 64% in remission/low disease activity at the 1 st visit and follow-up interval was 17.5 weeks (standard deviation 9.4 weeks). At the 2nd visit, 11 out of 59 patients had a flare while 10 out of 33 patients improved.
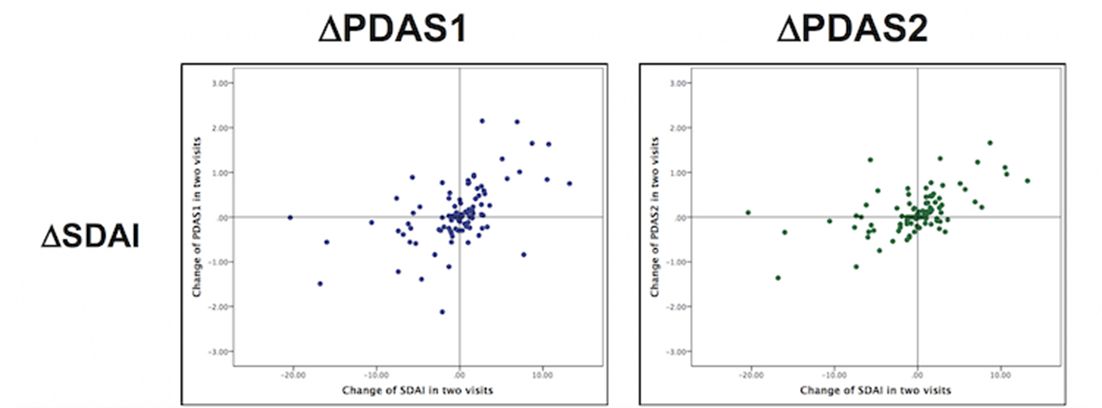
The Spearman correlation coefficients of ΔSDAI with ΔPDAS1 and ΔPDAS2 were 0.55 and 0.54 respectively (both p≤0.001). Data distributions were depicted in the scatterplot.
For the subgroup of flare, both ΔPDAS1 and 2 were significantly associated with the corresponding ΔSDAI (all p<0.02). However, this association was not significant in the subgroup of improvement (See table 1). PDAS1 did not appear to perform better than PDAS2 in both groups of flare and improvement.
Flare (n= 59) |
|||
|---|---|---|---|
Flare (11/59) |
No flare (48/59) |
P-value |
|
ΔSDAI |
+6.90 (8.20) |
0.12 (0.16) |
<0.001 |
ΔPDAS1 |
+0.75 (1.40) |
0.01 (0.59) |
0.016 |
ΔPDAS2 |
+0.52 (0.74) |
0.00 (0.32) |
<0.001 |
Improvement (n= 33) |
|||
Improved (10/33) |
Not improved (23/33) |
P-value |
|
ΔSDAI |
– 6.80 (7.20) |
0.40 (6.90) |
<0.001 |
ΔPDAS1 |
– 1.40 (0.96) |
0.06 (0.49) |
0.20 |
ΔPDAS2 |
– 0.16 (0.35) |
0.00 (0.54) |
0.25 |
Conclusions: Overall PDAS1 and 2 are sensitive to change, but both predicted flare better than improvement. Clinically signalling flare has a far greater utility than documenting improvement. PDAS2 was as sensitive as PDAS1 in predicting flare yet without the need of a blood test for ESR. Hence, PDAS2 is suitable to serve as a purely patient-based home monitoring tool to detect a flare.
References:
Disclosure of Interest: None declared
DOI: 10.1136/annrheumdis-2018-eular.2746