fetching data ... 
Background: S100 proteins has been reported to be a biomarker associated with disease activity in SLE, but it is not clear which pathophysiology of SLE S100 protein reflects [1, 2].
Objectives: This study aims to determine the utility of S100 protein measurement as a therapeutic indicator for SLE.
Methods: SLE patients who received additional treatment at our hospital from January 2016 to December 2023 were included. SLEDAI-2K, SLE-DAS, and CLASI score were used to assess disease activity, and serum S100A8 and S100A9 were measured using ELISA (CircuLex ELISA KitⓇ,MBL); the association between S100 protein and disease activity indices, organ lesions, and treatment content were analyzed before and after treatment.
Patients were divided into five groups according to the type of immunosuppressant added: HCQ alone (HCQ group), low-dose glucocorticoid (GC) or combined with immunosuppressant (IS group), medium or higher GC (GC group), belimumab (BEL group), and anifrolumab (ANI group), and the relationship between each treatment and changes in S100 protein was investigated. Statistical analysis was performed using JMP® 17.0.0 software (SAS Institute, Cary, NC, USA).
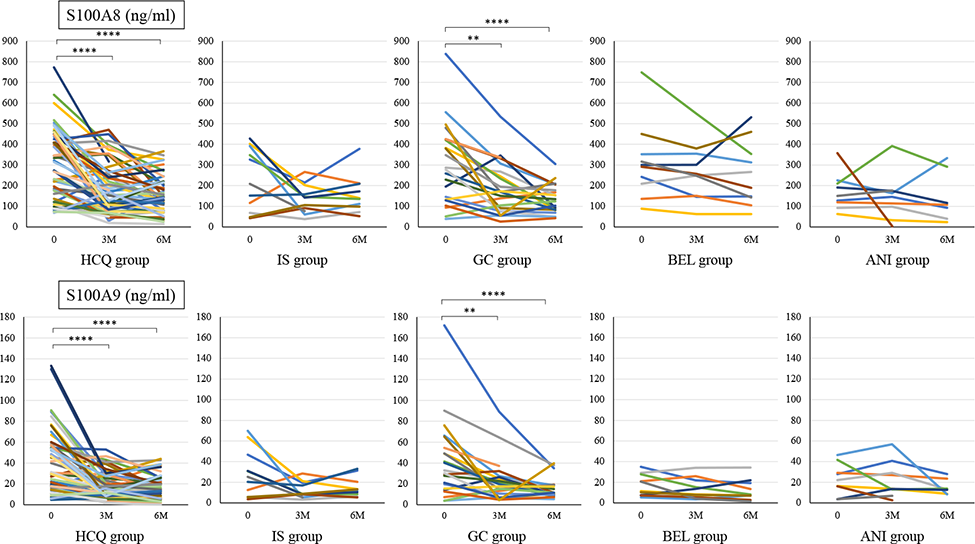
Results: This study comprised 109 SLE patients, 101 females, with a mean age of 42.3 years old. The median disease activity score was SLEDAI 4 points and SLE-DAS 4.3 points. The median values of S100A8 and S100A9 were 271.5 ng/ml and 27.8 ng/ml, respectively, with no clear association with overall disease activity index. However, it was higher in patients with lupus nephritis (S100A8 p=0.037, S100A9 p=0.035,) and in skin involvement, serum S100 protein was higher in patients with higher CLASI activity scores and positively correlated with S100A9 (r=0.19, p=0.044). After 3 months of treatment, all disease activity scores and S100 protein levels decreased significantly (p<0.0001).
In the examination by treatment type, compared to the HCQ group (SLEDAI: p=0.001, SLE-DAS: p=0.0124), and titers of the dsDNA antibody was significantly lower in the ANI group than in the other four groups (p<0.0001).
Before treatment, S100A8 and S100A9 levels were not significantly different among all the groups, but S100A8 was lowest in the ANI group and S100A9 was lowest in the BEL and ANI groups (Table 1). Regardless of treatment type, S100 protein decreased after 3 months of treatment (Figure 1). S100A8 and S100A9 levels decreased 3 and 6 months after treatment in the ANI group, which had lower S100 protein level before treatment, and the rate of decrease in S100A8 and S100A9 levels after 3 months was not significantly different in all the groups.
Conclusion: S100 protein decreases with declining SLE activity and may be an indicator of disease activity that reflects treatment efficacy.
REFERENCES: [1] Kim JW, et al. Front Immunol. 2022;13:886209.
[2] Ruacho G, et al. Lupus Sci Med. 2022;9:e000607.
Table 1. Characteristics of patients with SLE enrolled in this study
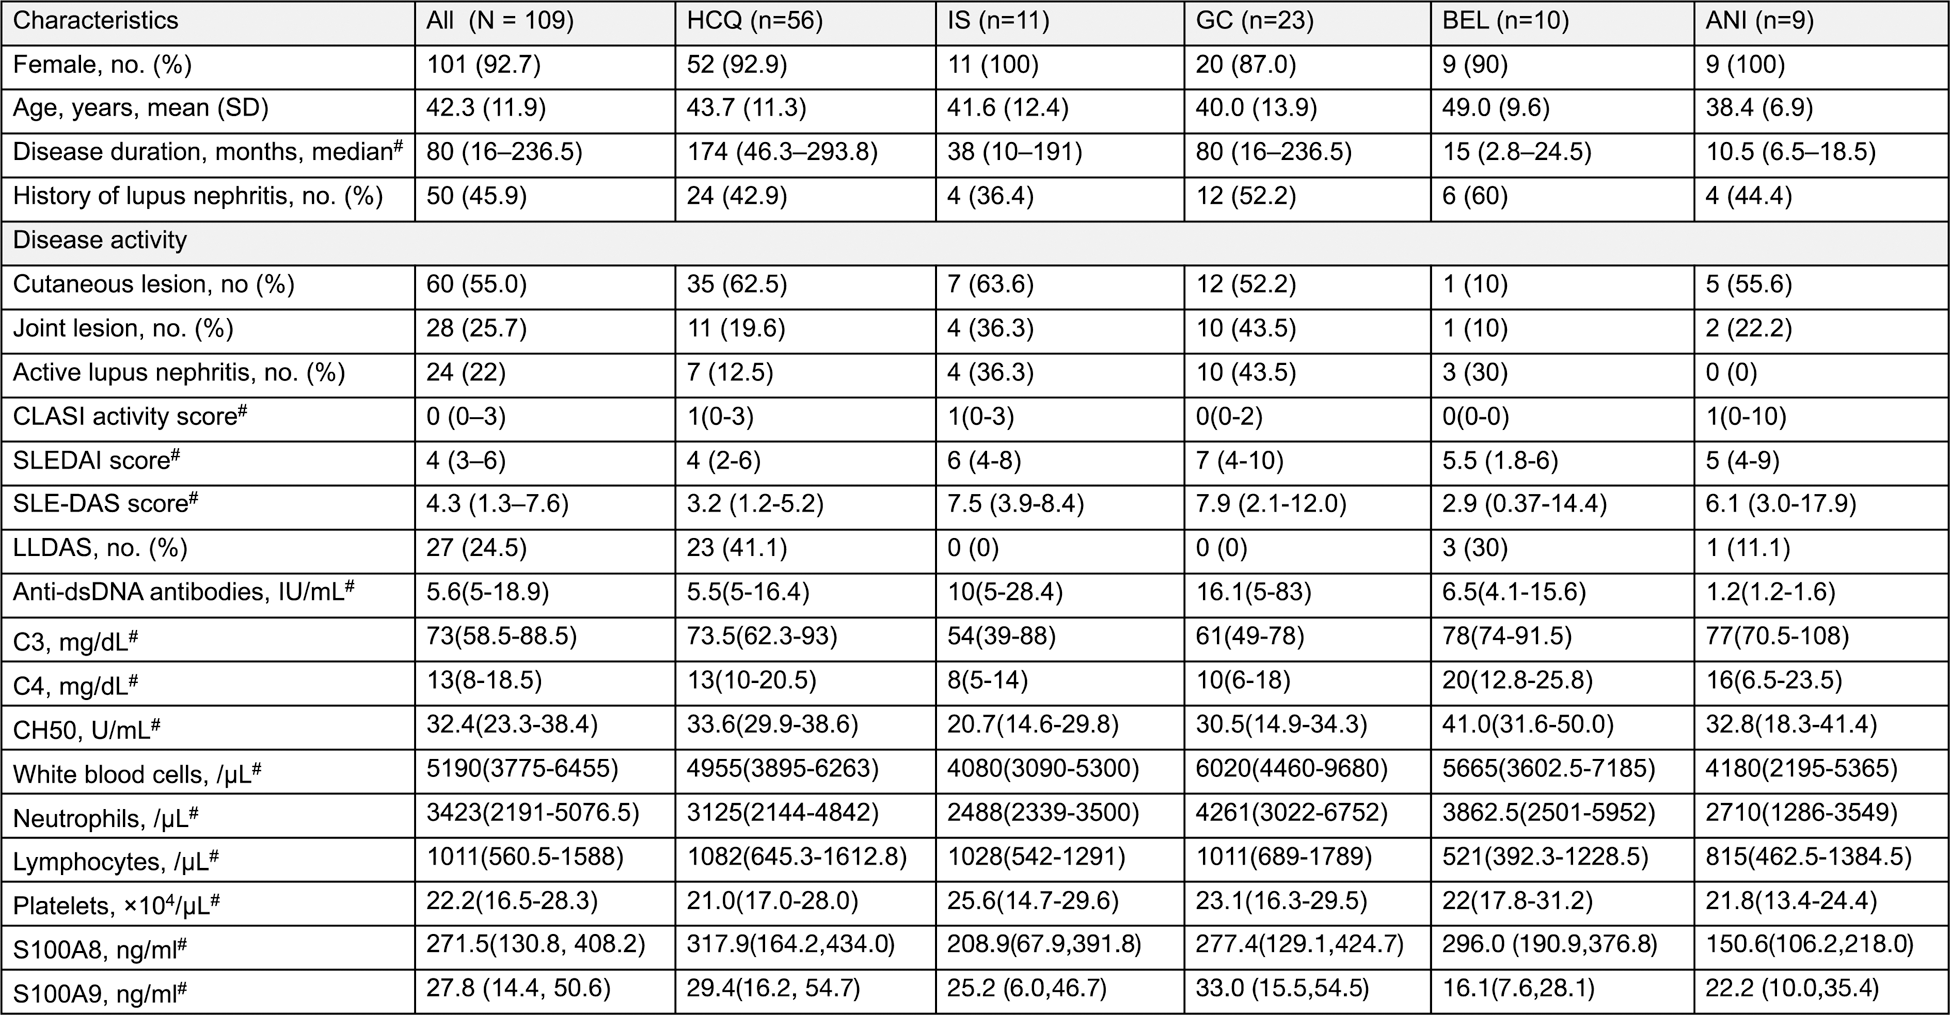
#Nonparametric distributions are represented as median (interquartile range [IQR]). low disease activity state scale: LLDAS.
Serum S100A8 and S100A9 levels at baseline were compared with levels after 3 and 6 months of additional treatment with Bonferroni correction.
For statistical analyses, ****p<0.0001, **p<0.015, p values were determined using the Wilcoxon signed-rank test.
Acknowledgements: NIL.
Disclosure of Interests: None declared.